
In my previous blog post ‘Influencing Systems Change with ConnectionsExpert’ we have seen why every single employee is invaluable for an organization to reach a single common goal: to improve the way we work together and get work done more effectively. Collaboration, as we all know, comes with many flavors. We are all used to working in small teams (i.e. strong ties), but what about collaborating with the people who we do not know (i.e. weak ties)? Are you leveraging your enterprise social networking platform to also unleash that potential?
In this blog post, I will now take a look at other scenarios, where a significant number of employees log into your Enterprise Social Network (ESN) to communicate, collaborate and engage with one another at least once a week. How does that impact our collaboration landscapes?
Modern ESNs are driving new patterns of collaboration into the organization. Understanding those patterns and making sure they work well is the secret of a successful digital transformation program. For example, a group of expert engine engineers who have been designing gas and diesel engines in the past, should design a new drive technology, they would probably concentrate on further innovating gas and diesel engines instead of rethinking technology and developing a complete new electric engine. Sometimes we need to think out of the inbox.
Communities are the major enabler of social networking and collaboration across the board within the enterprise. They exist to help involved practitioners do better at their jobs, deepen their skills and expertise as well as learn and connect with people.
Measuring and evaluating community activities is key to evaluate the collaborative maturity within your organization. It is extremely vital to sustain and increase productivity, effectiveness and, innovation while embracing a passion for open collaboration. The more work practitioners are consistently bringing into communities, updating data and creating new contacts, business opportunities, and solutions, the more likely your business is healthier and stronger.
Understanding the health and productivity of communities should therefore be your paramount priority.
Here is how ConnectionsExpert can help you and your organization augment that collaborative diversity while keeping the momentum going:
Let me now walk you through each of them step by step.
#1 Streamline The Community Building Program
There is no exclusive metric that can be used as a benchmark to assess how many communities are optimal for efficient and effective collaboration within the organization.
However, you should make sure practitioners do not lose sight of the community overview where its content may potentially be distributed redundantly across multiple communities. By keeping the number of communities to a reasonable minimum, a long and confusing list for members to choose from is avoided. By archiving unused ones, creating a streamlined list, and reviewing requests for new ones, your communities will most likely deliver optimal business value at all times.
ConnectionsExpert will help you achieve this goal by looking at the following dashboards and metrics:
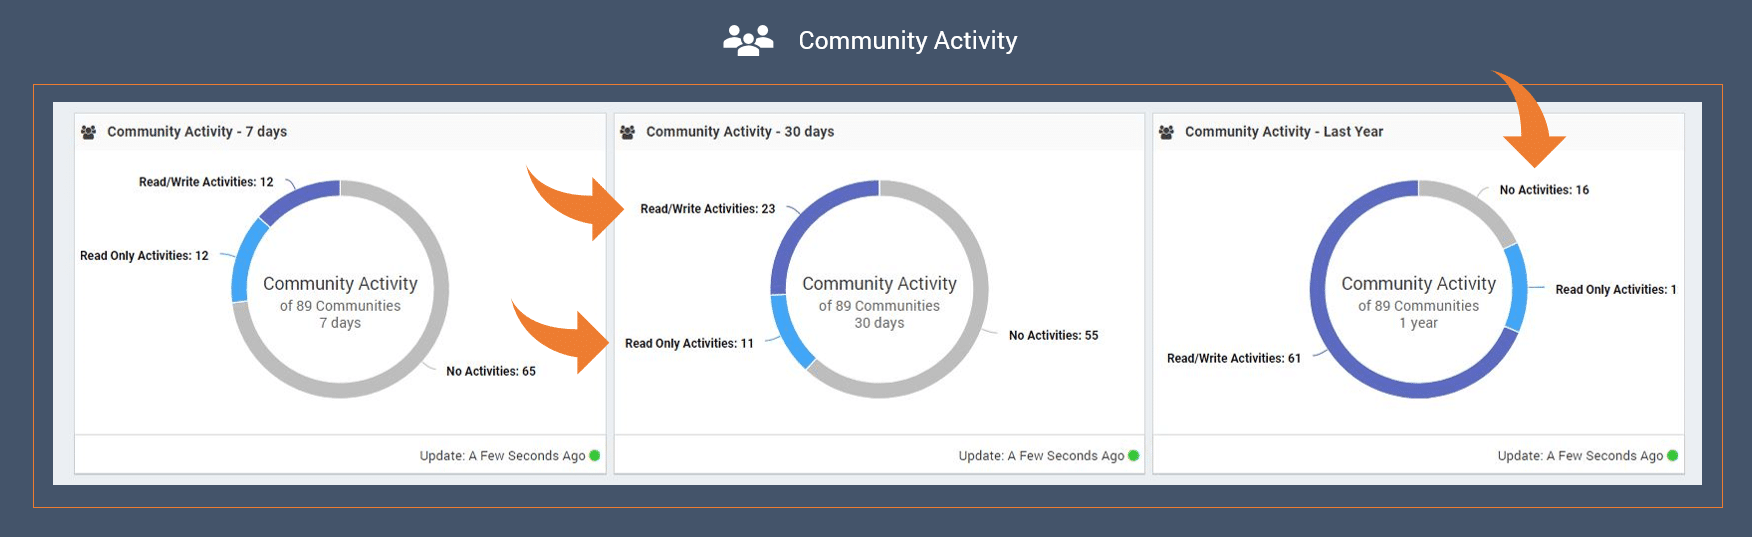
These numbers are your starting point to understand if your organization is working out loud and where facilitating your community program can be enhanced.
- By looking at the communities that are being accessed, you get a glimpse of how the employees interact within the existing communities over time. Whether they share (‘Read/Write’) or just consume (‘Read Only’) information.
- Particularly looking at the ‘No Activities’ number in the ‘Last Year’ gauge, will give you an orientation as to how many communities haven’t shown any activity within the last year and may be subject to archiving or sun-setting.
The best way to start the process, is start investigating communities that did not show any activity for the longest time. From there, work your way up to the latest data. Before archiving a community, I highly recommended to cross-check with the community owner(s) whether the community has got any current relevance or business value.
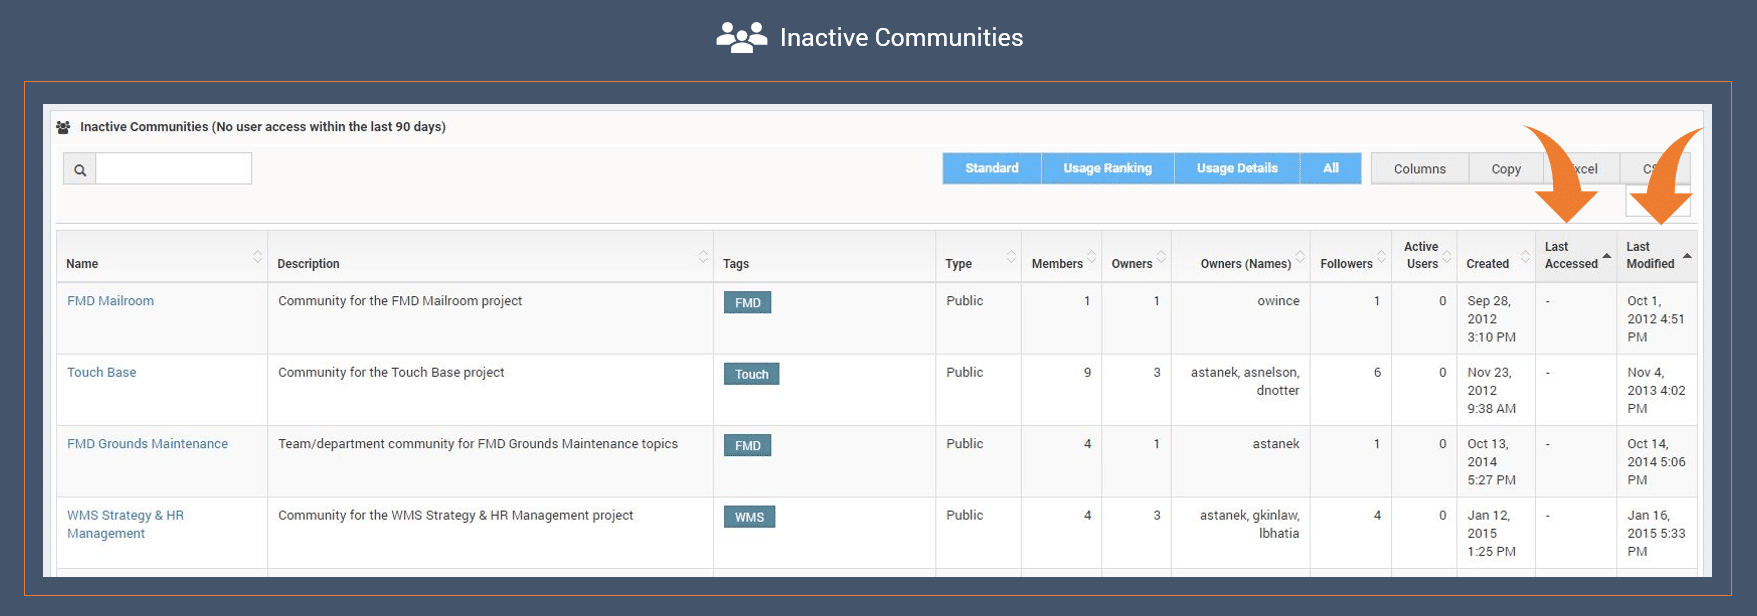
Continually streamlining the number of communities by archiving inactive ones comes with several benefits like:
- Keeping the list of communities manageable and relevant to practitioners
- Making it easier for them to find the right community to join in right away
#2 Ensure communities have a critical mass of practitioners
The community group size is almost always the key determining factor of member activity. The greater the number of members in a community, the greater the potential benefit. As the community grows in size, it becomes more likely that experts contribute, that questions will be answered, and that a variety of topics will be discussed, at the same that people connect and learn with one another.
The critical mass may differ from community to community. A good start will be to find the ones with low member numbers and try to merge them. When many people login daily the chance of having many understaffed communities is pretty high. If only a handful of people speak up, that will not usually sustain the momentum over the course of time.
However, remember that there might be specific communities, like C-suite communities, which will usually have a lower number of members by nature and that’s just fine, too.
ConnectionsExpert will help you find these communities by looking at the following dashboards and metrics:
The more individuals are active in the community, the bigger the bubble. Each color indicates the type of access the community has – is it available to all members of your social network or is it moderated or restricted to just a subset of members?
Further improvement measurement can be derived from this chart, which in turn support and promote the opportunity for more active and open collaboration.
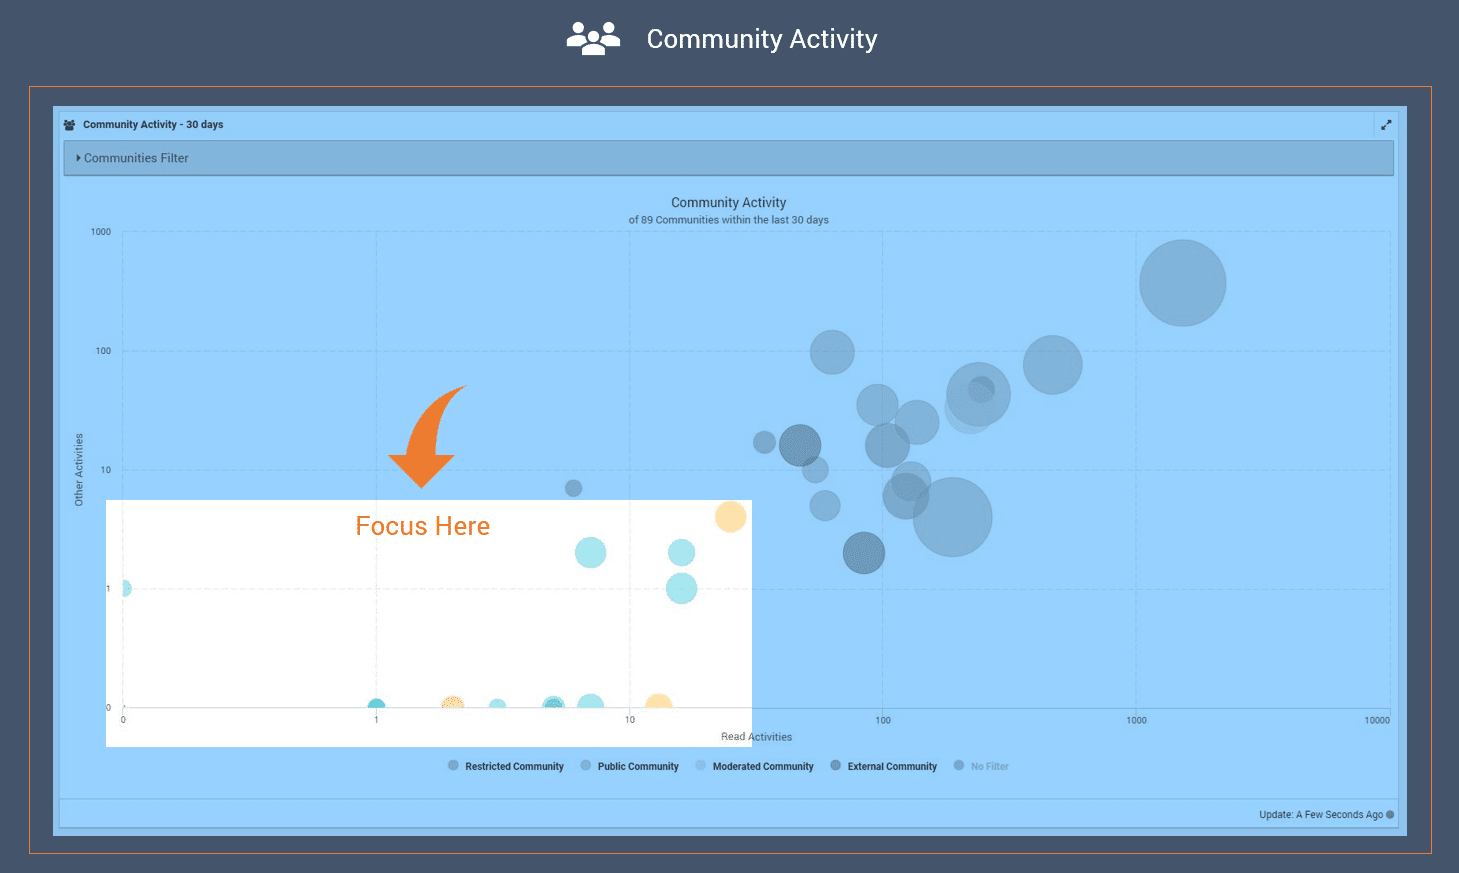
Focus on the lower left corner. In this area, you can reveal communities that show only little reads and any other form of activity. These communities are still used, but only to a small extent.
For such communities, a very effective measure can be merging these communities with others, as long as they are publicly available and on a similar topic.
- Simply move your mouse over the bubble to discover the community name
- Export the list of communities in the Community List dashboard as an Excel spreadsheet
- Cross-check if other communities with similar tags already exist
- Merge communities where advisable and applicable
This harnesses enthusiasm, injects new energy into the existing community, and prevents the fragmentation of members into isolated silos.
Even when creating new communities which address a topic already covered by an existing one, it could be more stimulating for the creator to become a co-owner of the existing one.
#3 Communities are open to any practitioner
Collaborating in communities cannot be programmed. Effective collaboration in communities is emergent.
An important factor in enabling social collaboration is openness and the ability for involved members to connect with others across different communities. Limiting access to such communities would deny them the possibility from learning and contributing to them further along. In general, members who could greatly benefit from participating by offering additional help to those already in the community.
The extent of openness indicates how advanced your organization is at transforming from document-centric to people-centric collaboration.
The key questions to be answered here would be:
- How many communities within our enterprise social networking platform restrict participation?
- How many of these restricted communities are particularly active?
The following dashboards in ConnnectionsExpert help reveal this important information and transform through openness towards people-centric collaboration across the board:
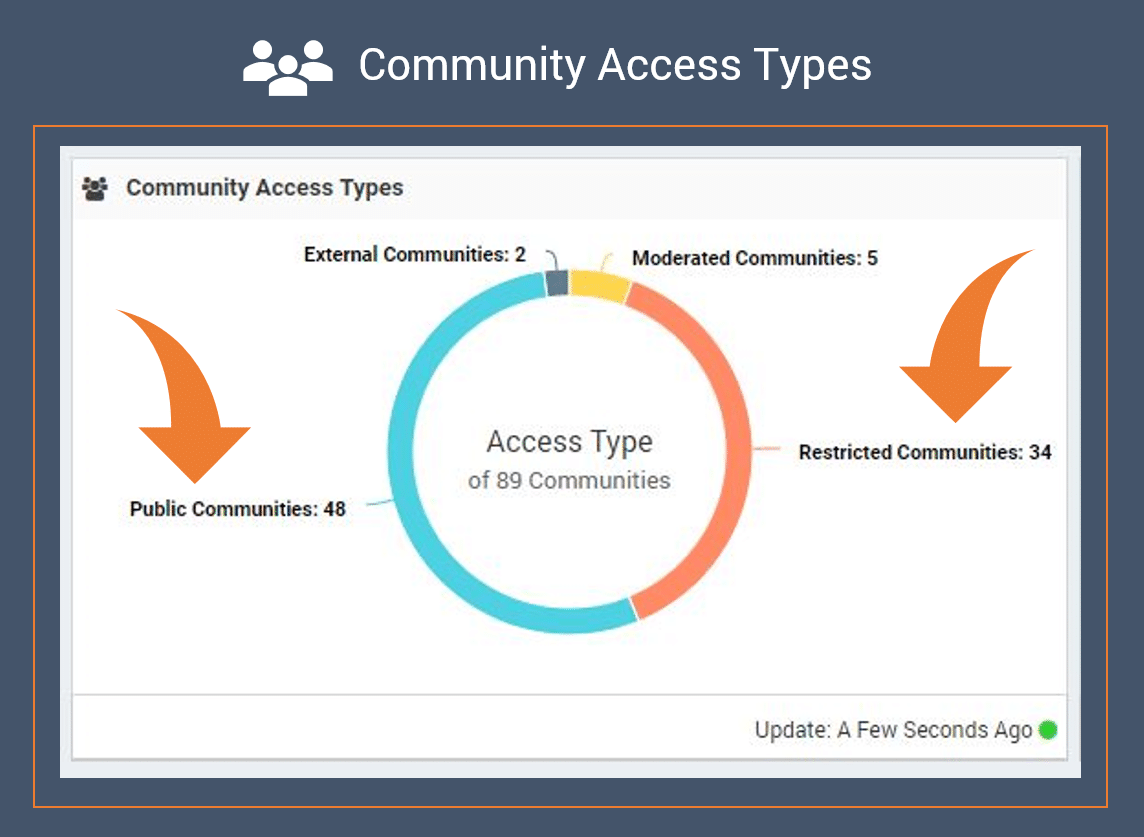
Restricted Communities are limiting access to content and active collaboration for certain people or groups of people and make it impossible for them to engage with it.
Keeping out people counteracts the idea of social collaboration goals and limits possibilities to learn from members of these communities; share ideas, insights, proven business practices, and practical hints and tips.
In general, the more Public Communities exist, the higher the opportunity to inspire a more creative, effective, and problem-solving collaborative environment. Or in other words, the higher the opportunity for your organization to work out loud and succeed in transforming how people collaborate with each other.
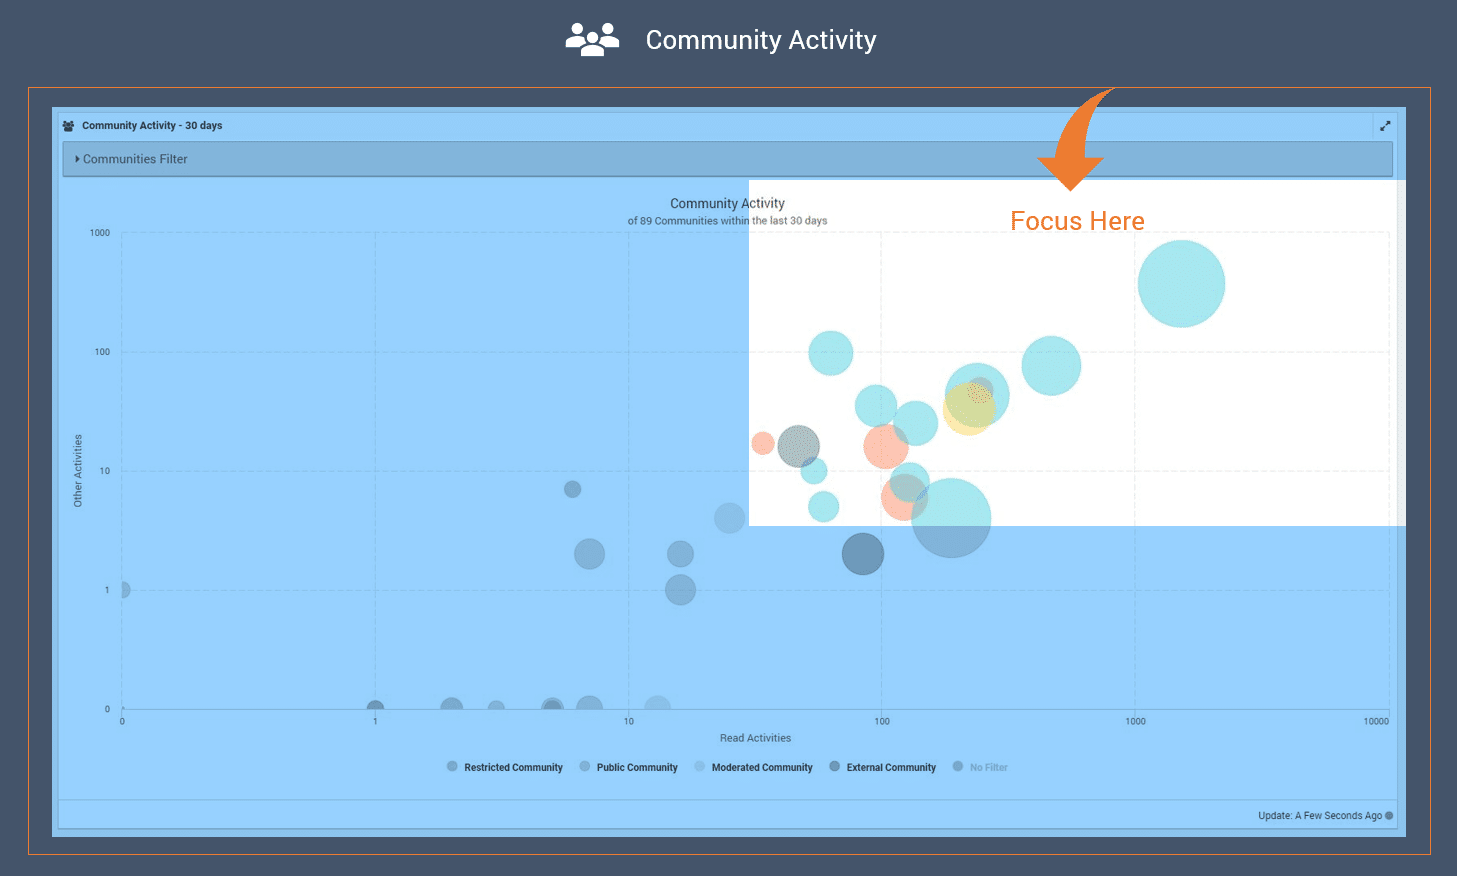
Concentrate on the Restricted Communities, shown as red bubbles, in the upper right corner.
These are very active communities in which, probably a lot of restricted information is exchanged. Information which could be interesting for other members to collaborate on.
Your priority may well be, to influence the community’s collaborative behavior and overturn as many of them as possible into Public communities. The easiest way to get in touch with a specific community Owner would be:
- Simply move your mouse over the bubble to discover the community name
- Identify the name(s) of the community Owner(s) in the Community List dashboard
Communities should, by default, be open to anyone aligned with the defined purpose of the community itself. Beyond organizational structures and boundaries, communities take advantage of diverse experiences, perspectives, and talents.
If you are interested in evaluating the status of specific communities, I recommend using the filter dialog above the chart. That way, you can get rid of all other community bubbles displayed in the grid and analyze, most efficiently, only the status of the individual communities you are interested in.
#4 Understand how your communities really operate
In addition to openness and transparency, another important factor to take into account, is the shift of patterns in collaboration within your own organization over the course of time. Change is an ongoing process, we all know that. Therefore, it’s relevant to evaluate, on a regular basis, the status of your transformation process from document-centric to people-centric collaboration.
It is essential to examine whether and how the members of a community collaborate with each other and which IBM Community Apps are utilized to share and distribute knowledge.
The best way to find out is to pick up a community and analyze exactly if the members interact with each other and the whole community in a document-centric and/or people-centric manner. The more communities that are collaborating in a people-centric way, the more advanced the collaborative maturity of your organization.
Answering the following questions will allow you to determine the collaboration behaviors of each community:
- Is it a public or restricted community?
- Which Apps are used for what purpose by the practitioners for collaboration?
- How are the Apps themselves used for collaboration?
The following example will demonstrate how to evaluate the collaboration behaviors based inside a community with lots of active members.
ConnectionsExpert will help you find a specific community by looking at the following dashboards and metrics:
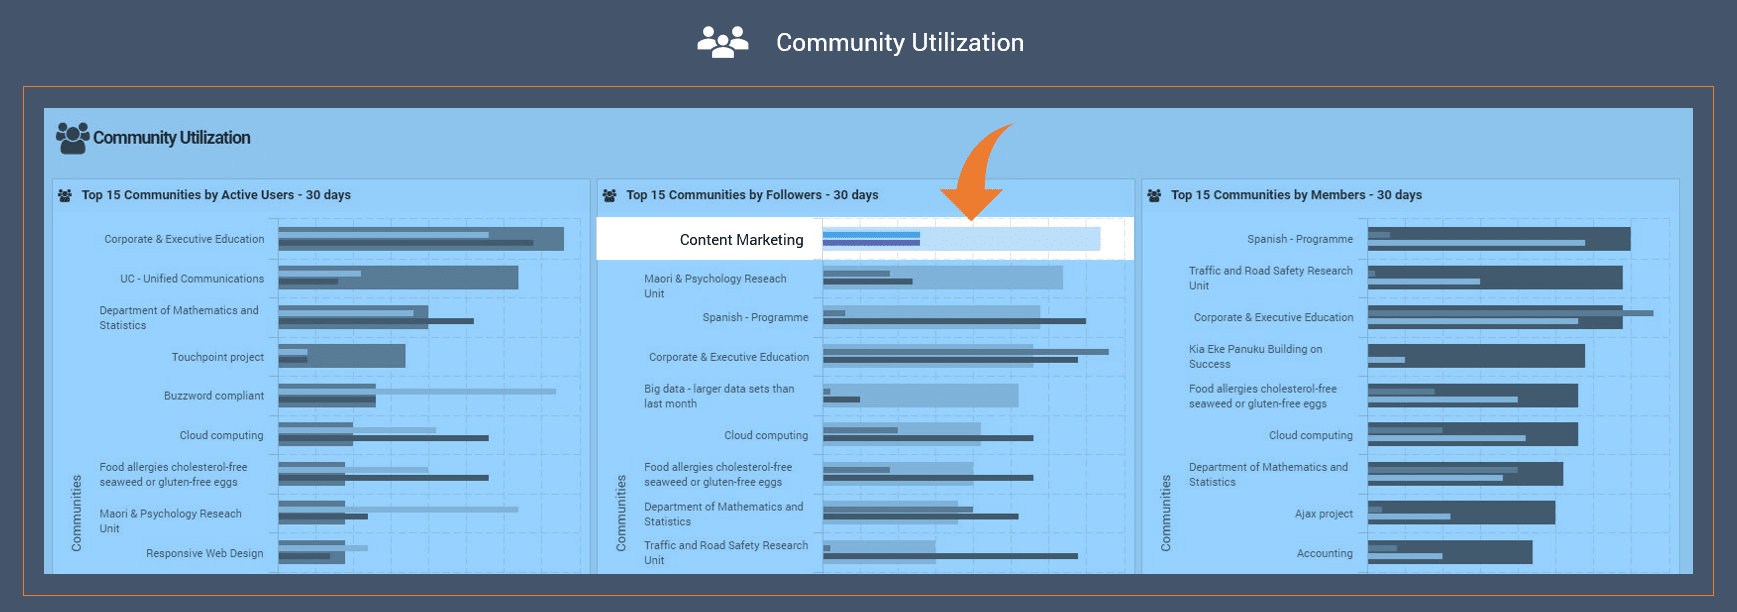
As these are the most popular communities they provide a compelling amount of activity data. In addition to this, we can assume each community also has a good spread of early adopters, and active knowledge practitioners.
For this example, I randomly select the community named ‘Content Marketing’ which is the first one in the ‘Top 15 Communities by Followers’ bar. A quick check in the ‘Community Activity’ bubble chart shows me that it’s a ‘Public’ community with 41 members.
By double-clicking on the community name, the Community Details page will be opened. This page provides additional significant insights into the Apps utilization and the many collaborative activities in a concrete period of time.
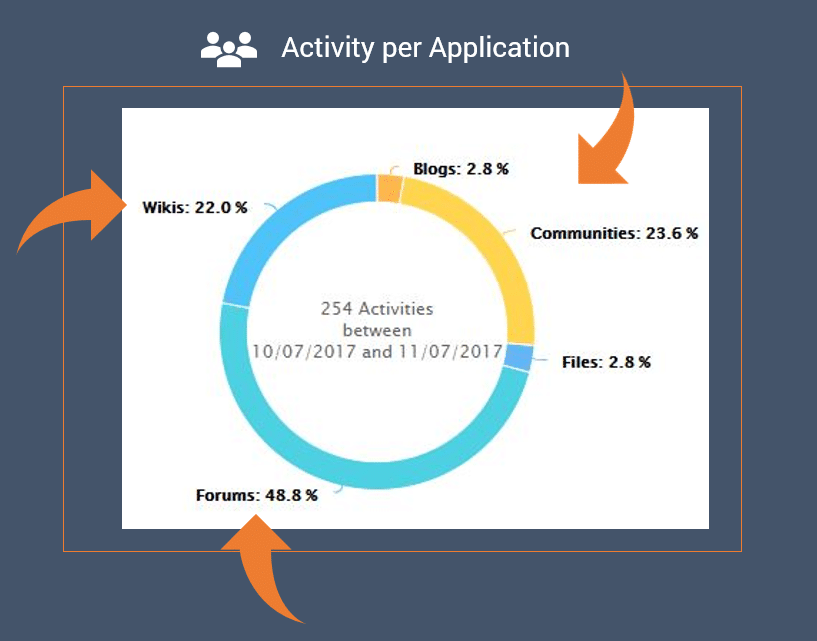
Certain Apps in IBM Connections characterize themselves for a specific collaborative behavior because of their usage patterns and technical capabilities. For example, the App ‘Files’ is often used to share and work on files whereas the App ‘Forums’ is mostly used to actively contribute, share new ideas, ask questions and discuss information.
You probably can categorize the utilization of Apps in the following manner:
Document-centric (observing)
- Files
- Media gallery
People-centric (narrative)
- Blogs
- Forums
- Bookmarks
- Wikis
- Profiles
- Communities
To proceed with the analysis, sum up the percentage numbers of each App in the above donut chart according to the already mentioned table. By looking at the result, you can quickly reveal a collaboration pattern of the community members:
- Files sum up to: 2,8% document-centric collaboration
- Blogs, Communities, Wikis and Forums sum up to: 97,2% people-centric collaboration
We can then conclude that members of the community ‘Content Marketing’ are well on the way towards people-centric collaboration. Accordingly, it’s essential to identify how the members themselves use the Apps for further interactions.
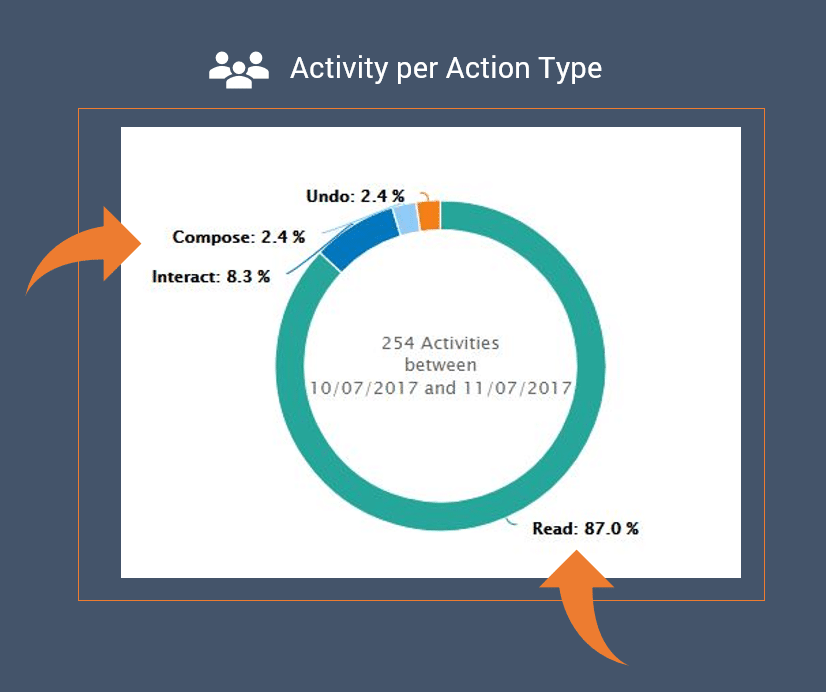
- ‘Compose’ activities indicate that the members actively share new information and collaborate through discussions, conversations, and interactions
- ‘Interact’ activities specify members that actively click on Like, or Follow buttons
- ‘Read’ activities illustrate that most members only consume information
By looking at the numbers you can quantify that exactly 87 % of all activities are Read activities and only 2.4 % are Compose activities.
Based on the data, you can quickly make a first statement about the extent to which the community has already made the leap from document-centric to active people-centric collaboration.
To sum up, we discovered these insights linked to the community ‘Content Marketing’:
- It is a public community
- 41 active members engage with the community (4 Owner, 37 Followers)
- Members are primarily collaborating through people-centric Apps
- The community itself is #1 community by Followers in the last 30 days
Which other conclusions would you draw with respect to the shift towards people-centric collaboration? How happy would you be with the current status of that transformation process?
As you can see, understanding some of these patterns and making sure they work well for you and the organization is the secret to a successful digital transformation program.
CONCLUSION
I’m increasingly convinced that understanding and harnessing people-centric patterns of open collaboration, is fundamental to the success of our digital transformation initiatives. I used to think that this meant collaboration platforms would be the key. While they are important, this goes far beyond technology and into the very nature of the organization and how it is structured, managed and organized. Getting the right mindsets, skillsets and culture in place is just as important.
- Communities are our major enablers for valuable transformation through social collaboration
- Openness, clarity and transparency are key to changing from a document-centric to an active people-centric mindset
- Working out loud is the beginning of the journey
In short, keep this question in mind when you’d want to understand better what fuels the success of your organization’s digital transformation initiative:
Is Your Organization Working Out Loud Yet?
In case you missed the previous posts, here they are:
Related posts: