Amid the pandemic most companies have started supporting employees‘ home office equipment so they can communicate and collaborate effectively. This includes their home networking gear and their monthly subscriptions to internet service providers (ISPs). But how can the IT support group know how well these are performing?
An end user calls the helpdesk and complains that their Teams call was “not perfect” and requests an investigation into the root cause of the problem so it can be fixed. Yes, in these special times where people are working all over the place, it is very important that call and video performance is working at its best. However, to build the true picture of end-user experience for Teams call quality, there are some crucial metrics that need to be gathered for full transparency.
These include client telemetry data and network performance, mixed with the information coming from the Microsoft’s Call Quality Dashboard (CQD). Together these provide the details to perform accurate end-to-end call quality analytics for Microsoft Teams.
Client telemetry data and the underlying Operating System
The client device is always the center piece in the analysis. It is the starting point where a Teams call is being triggered and it is the device itself where audio, video and screensharing happens. Capturing telemetry data from the user endpoints while a call is running, is therefore essential to monitoring and analyzing call quality.
Many call quality issues have a direct correlation with slow device performance. Whether it is high CPU utilization or high memory usage or an old Bluetooth headset, the client telemetry data from a user endpoint will provide the necessary insights. But it is not only telemetry data which matters here. Employee computers are updated regularly and could affect the performance from previous experiences. You need to consider these aspects as well. Knowing the operating system updates and device driver versions will help you narrow down a reported problem. Things like that can only be answered if you collect this data and include it in your big picture analysis.
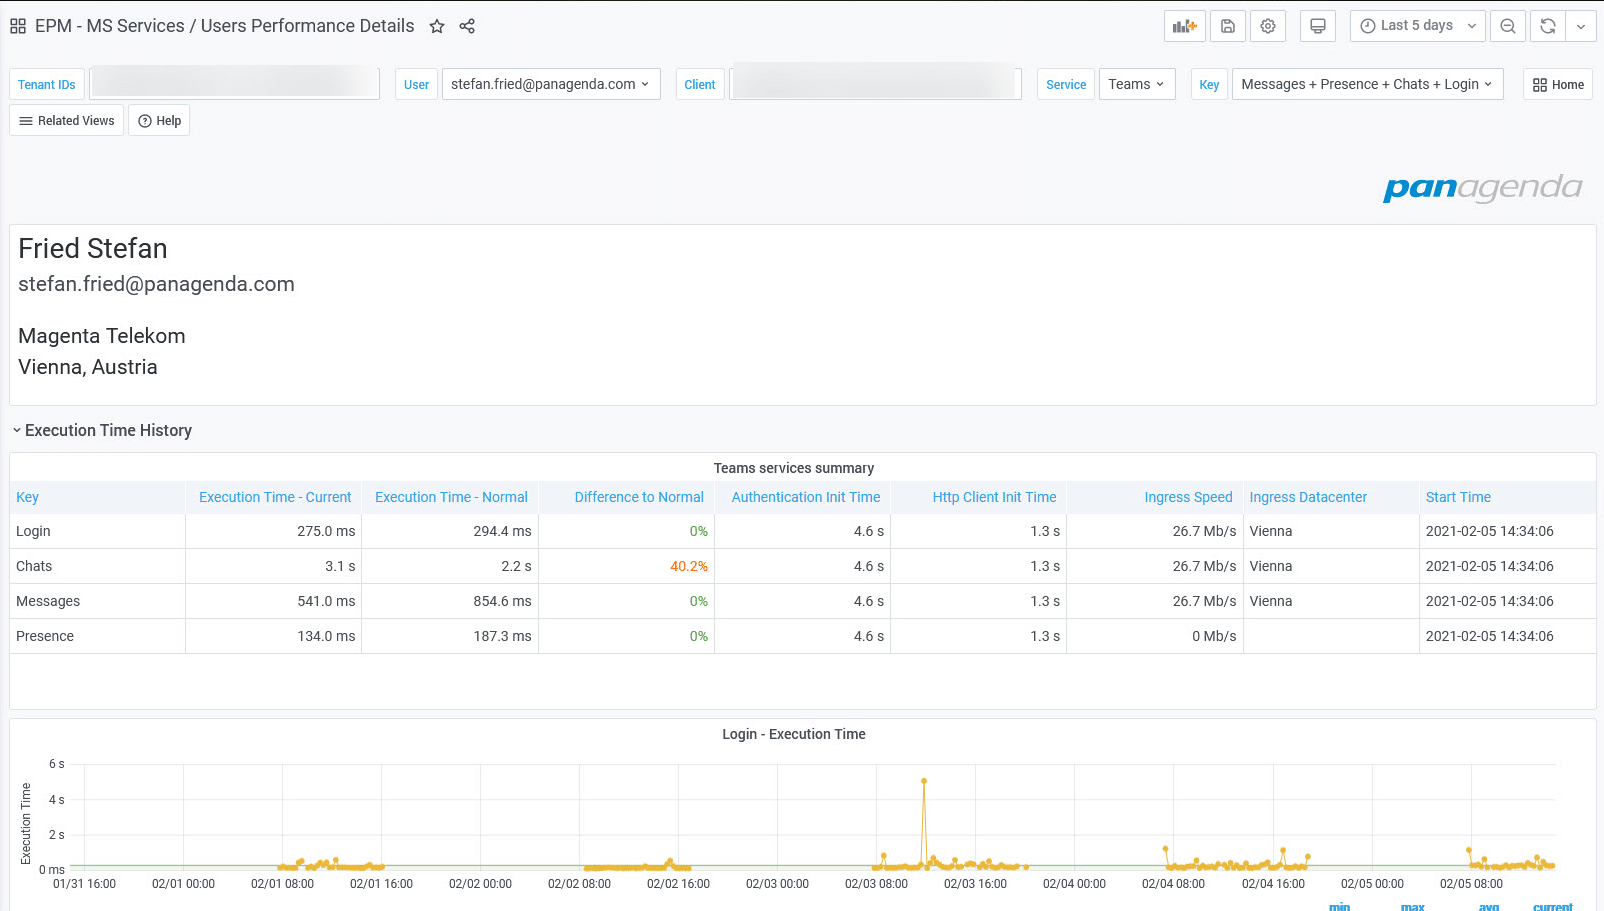
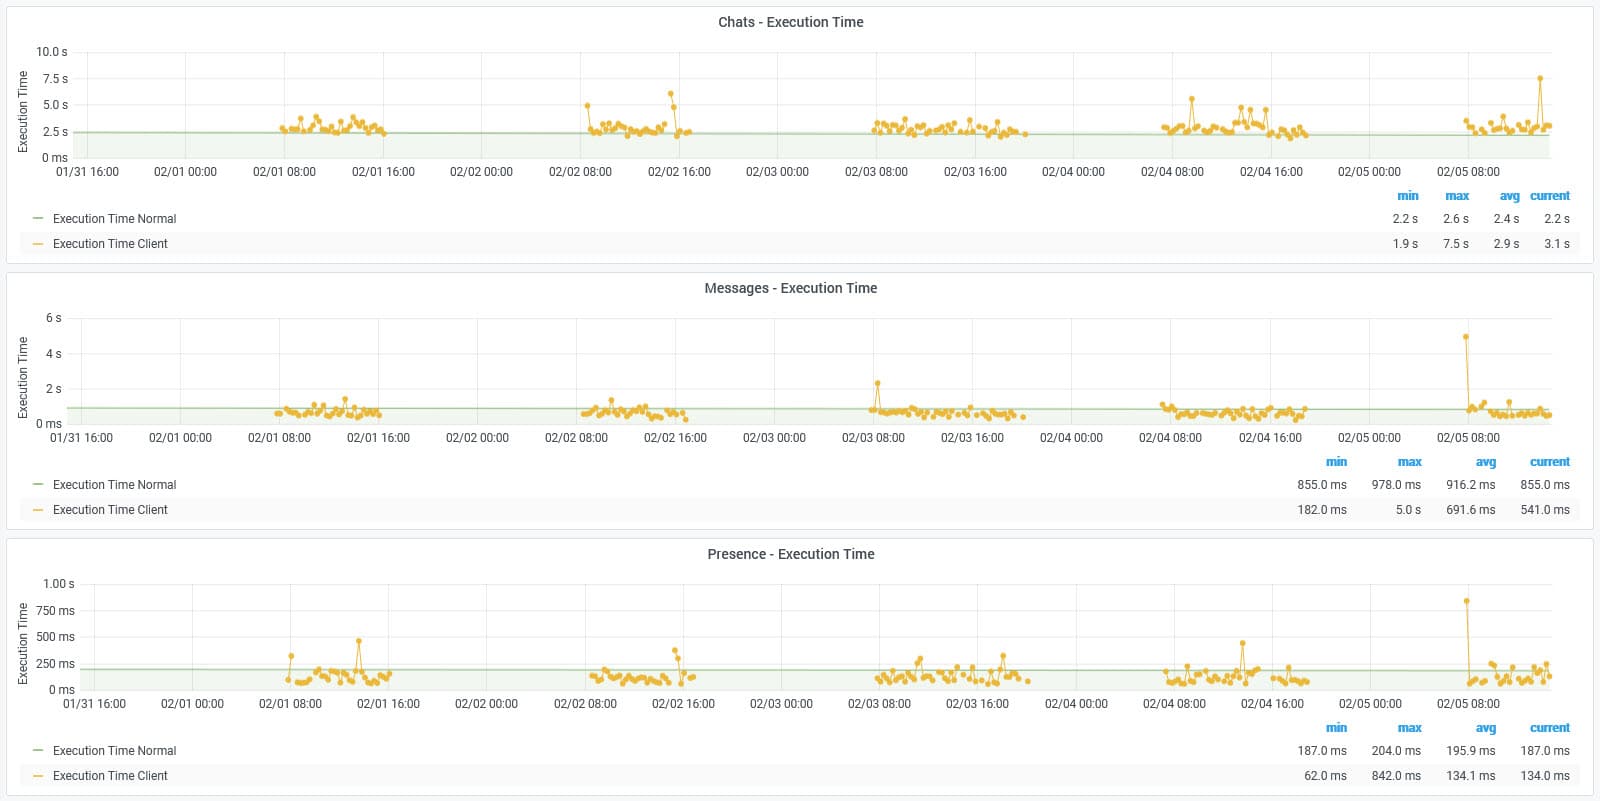
Example Report on User Endpoint Performance
The screenshots show an individual user with Teams end user experience measurements targeting different endpoints (e.g. OWA, ActiveSync, ..:) of the last 5 days.
Monitoring network routes and performance
The next important factor to build the clear picture for call quality analytics is related to network performance. Voice and Video calls all pass through multiple network levels:
- Local home office, or business building
- ISP
- Microsoft cloud
Every one of these levels can influence the quality of your Teams calls. The first level is completely under your control (either by the employee or by the IT department supporting the office building) the other two, however, are not. We have recently published a blog where we analyzed the importance of the ISP connections and how they can have a negative impact on call quality.
Another reason why you should monitor the network closely is to identify the number of routing hops until users are connected to the Microsoft cloud. Employees residing in the same geographic area may be connecting to different Microsoft datacenters to access the company tenant. Monitoring how many hops are included in the networking trip, and what the termination point is for tenant access, will help provide the useful insights to troubleshoot issues before they are reported to the helpdesk. With that information you can pinpoint potential performance problems proactively and make necessary adjustments.
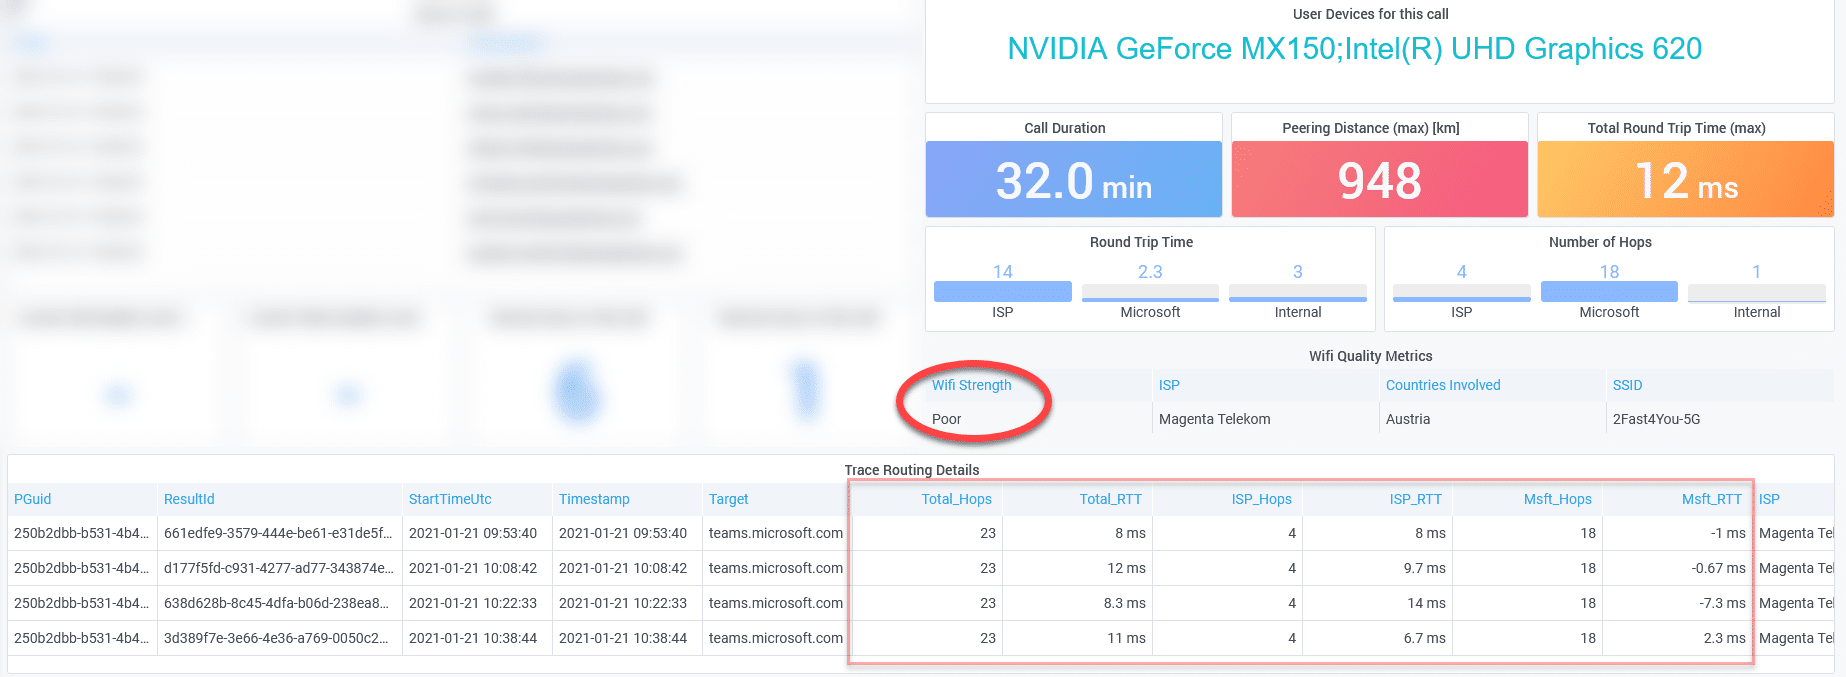
Example Report on Home Office Network Performance
The screenshot shows the three networking areas (Internal, ISP and MSFT) and also provides an indication of the Wi-Fi signal strength during a particular Teams Call.
Leveraging the Microsoft Call Quality Dashboard (CQD)
The CQD reporting provided by Microsoft is extremely helpful to track and monitor call quality issues at a regional level. Some data is now available within 30-minutes of actual calls made. One of its key strengths comes from several Power BI reports where customers can drill down on certain layers to review overall performance at a high-level.
Relying solely on CQD to perform troubleshooting and in-depth analytics does spotlight its weakness, however. The solution does not track the details from each user endpoint to provide the insights for root cause analysis on reported call quality issues. Was the specific video call which was flagged “poor” by CQD caused by slow home Wi-Fi bandwidth, bad ISP network routing, or just bad desktop performance or even because of a recent system update? To understand the complete picture for detailed call quality analytics, you need the rest of the metrics, or the puzzle pieces, to provide complete transparency.
The law of big numbers – Live Usage Data from every client matters
You may have heard about synthetic monitoring, where a piece of software performs regular user activities to mimic common tasks (e.g. accessing OneDrive to upload a file, or accessing different SharePoint sites). This approach is good as a starting point because it provides an indication of accessibility to cloud-based systems. We at panagenda for instance provide this with one of our offerings to identify service availability issues or downtime. But this is just guessing at what user tasks really are being performed.
This approach will not help you build a full analysis of user experience across your entire landscape. Actual user activity monitoring for your entire organization provides the truth about how your employees are communicating and collaborating with the technologies provided by corporate IT. And it provides the real-world insights on user experience, performance and response time when interacting with those technologies. Organizations should include endpoint performance monitoring because every client counts and matters!
The law of big numbers (in that case the large number of computers) helps you identify what is normal and what is not (e.g. mean vs standard deviations). Identifying a group of people suffering from poor call quality is only achievable if you are monitoring every single PC and not only a handful of computers where synthetic transactions are executed.
Find Out More…
If you are interested in learning more about our OfficeExpert data analytics solution and how it can help you troubleshoot call quality issues for your Teams deployment and maintain business productivity for your remote users, please visit our overview page online, or sign-up for a trial at https://www.panagenda.com/officeexpert/