
Page History
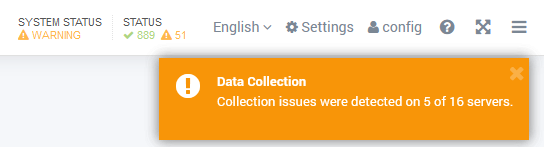
In case iDNA Applications detected detects collection issues on severs, you will see the following notification on the top-right of your screen right after login:
To see what collection issues occurred, just click on the notification to get directly to the Catalog > Servers view. In this view select Details from the dop down menu:
Then you will see any issues encountered highlighted in yellow, under the column where the issue occurred (Catalog, Domlog and so on). For example, in the screenshot below, you see that the server had issues with collection in Domlog where the last date collected was June 19th 2019:
To determine why the Domlog collector might have issues, we suggest to try the following troubleshooting options:
...
Here you will find an overview on what problems exist on which servers in the Issues column: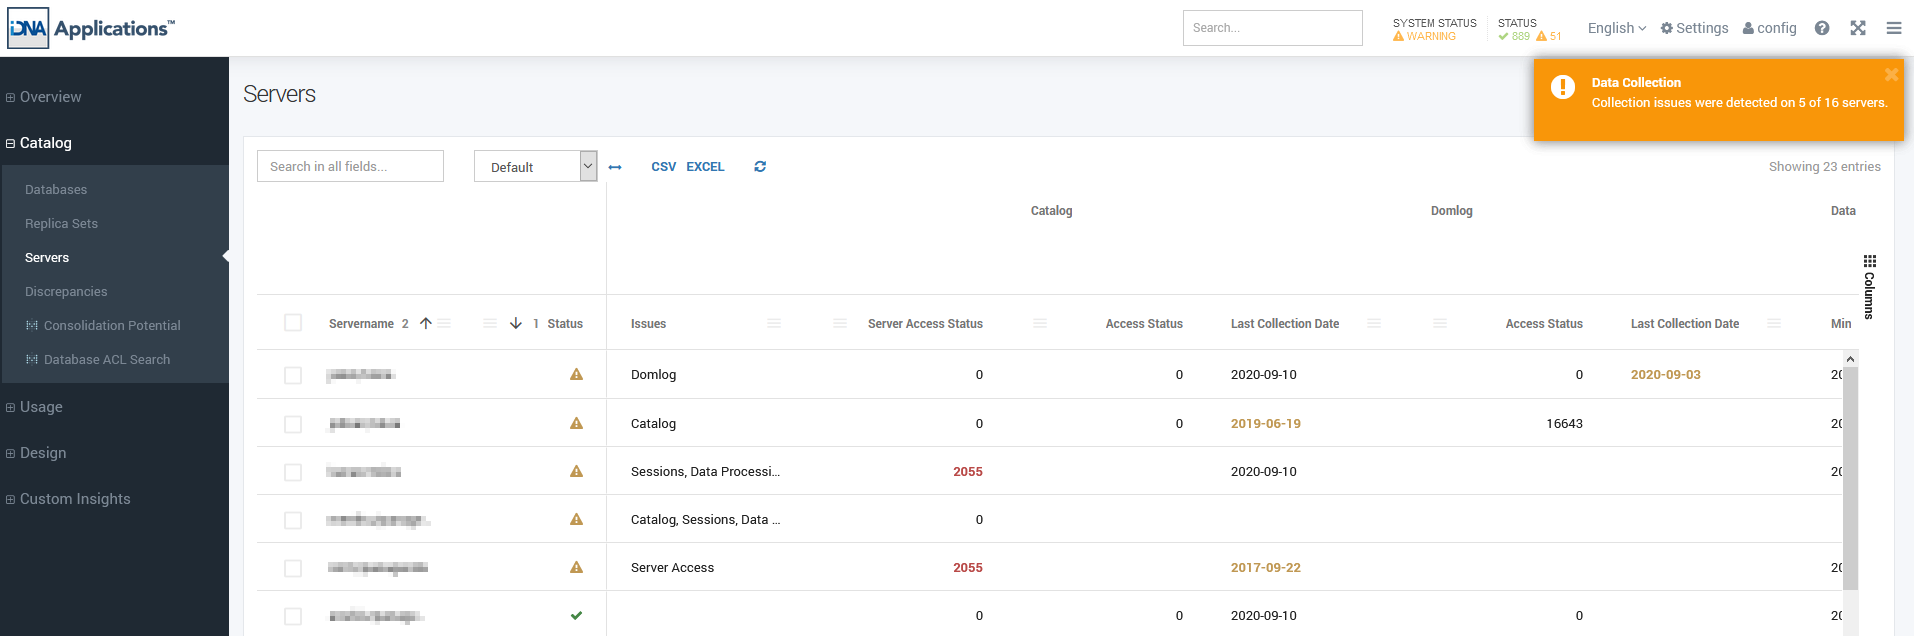
There are five types of issues that may be pointed out:
- Catalog - an issue exists with collecting data from catalog.nsf (access issues) or with the collected data itself. Check the column Catalog → Last Collection Date and verify that your Catalog Domino task is updating catalog.nsf daily.
- Domlog - an issue exists with collecting data from domlog.nsf (access issue) or with the available data. Check the column Domlog → Last Collection Date and verify that your domlog.nsf (or log files) are updated daily.
- Sessions - an issue exists with collecting session data from log.nsf (access issue) or with the available data. Check the column Sessions → Last Collection Date and verify that session data is being collected in your log.nsf.
- INI Config - an issue exists with a Domino server INI value that disables the collection of user sessions. Make sure the value LOG_DISABLE_SESSION_INFO does not exist or is not set to 1. Note: this warning will only occur if an extended access check has been performed for the server in iDNA's advanced settings (https://<your-server>/idna/sys/servers) and will only be as current as the last extended access check the status of the server(s) with issues. From there you can select specific servers by ticking the check boxes left to them and clicking on the link at the bottom of the grid:
Hovering your mouse over warnings or errors shows you details to a specific issue:If you cannot identify the issue from here, please consult .
- Data Processing - an issue exists with nightly processing in the data warehouse. Restarting iDNA Applications (by rebooting the appliance or issuing the command "ifa restart") usually resolves this issue. If the message persists for more than two or three days after the restart, please contact support@panagenda.com with logs (https://<your-server>/pac/logs) and a screen shot of the ETL log screen (https://<your-server>/idna/sys/etl) in advanced properties.
The previously mentioned Servers page (https://<your-server>/idna/sys/servers) in iDNA's advanced settings will have additional information on server status and gives the ability to re-scan servers: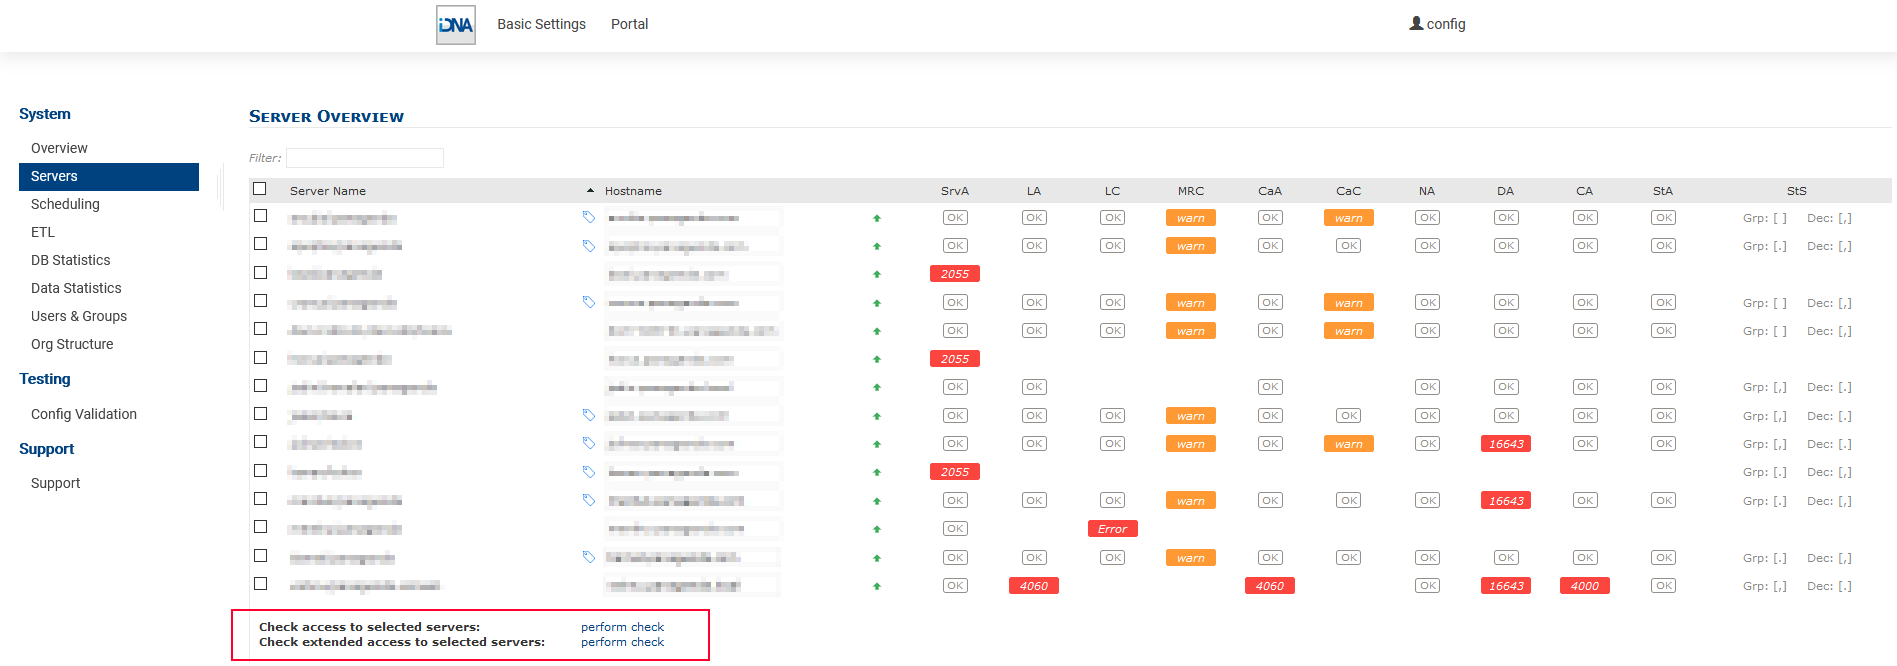
Two re-scan options are available:
- Check access is a relatively quick check that will make sure the servers and all critical DBs are available
- Check extended access will perform a more in-depth analysis that includes looking at server INI parameters and will require Domino Console access
If this article was not able to resolve your issue, please contact us at https://support.panagenda.com and include log files (https://<your-server>/pac/logs) in your message.