The Domino Mailflow Analysis Sensor gives you the flexibility to measure and monitor the Mailflow within your Collaboration environment. A typical use case is to monitor the mailflow towards the Internet or to measure the duration how long it takes to send a mail within an organization from A to B (example: between a Europe Mailserver and a Mailserver located in Asia).
Requirements:
Please make sure that a FullText Index is active (and running immediately) on the Target DB (check if there are no pending updates on the server level).
Make sure that the TargetDB Server is not suffering from a poor PendingUpdateList performance.
Make sure that the GreenLight Notes ID has "Create" Access on the mail.box on the specified MailGateway Server. (Greenlight creates an email inside of the mail.box instead of depositing one)
Mailflow Analysis towards the Internet
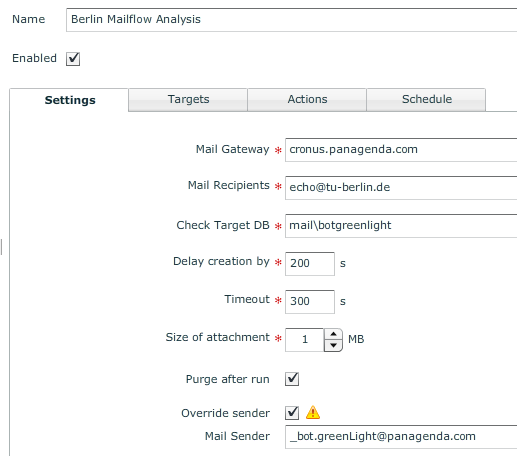
Create a Domino Mailflow Analysis Sensor with the following settings
- Specify the Mail Gateway where GL should drop the e-mail
- Enter as a Mail Recipients echo@tu-berlin.de (this address responds automatically to the sender of the mail)
- As a check Target DB you need to specify the Database in which the e-mail will be delivered (see Mail Sender field)
- Set as a delay creation by 200 secs and as a Timeout 300 secs (Note: 200secs means that after that time a NEW mail (new cycle) is triggered! the Previous cycle will stop after the 300sec timeout)
- Specify the size of the Attachment
- Select Purge after run (so that the sent e-mail will be deleted from the Database after GL did the measurement)
- Override Sender is necessary if you want to specify a different user compared to the use GL ID

- Specify Targets (where the Check Target DB resides)
- Specify Actions and Schedule it to run every 60secs (Note: the Schedule means, how often the Target DB is checked by GreenLight - it should be definitely less than the "delay creation by" value)
- Save/Close
So every 60secs GreenLight checks the target DB. If the mail was found, GL will process it and purge the document. If it was not delivered GreenLight will check in another 60secs.
After 200sec a new cycle will start and the privious will completely stop after 300secs (timeout)
Create a Chart
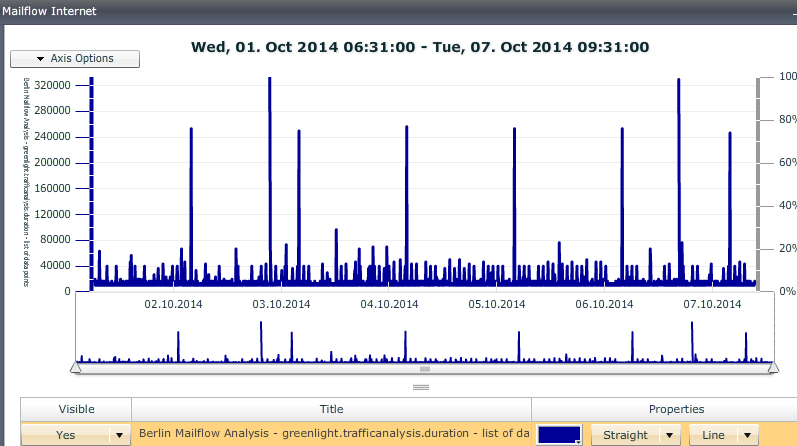
Create a chart in which you select from the above sensor the following statistical key (make sure that you have already collected some data)

The outcome of the chart is something like below:

Above picture helps you to identify how long a mail took to AND from the Internet. The average is ~ 15secs. As you further can see, with measuring the mail flow you are able to see when and how long certain peaks appear during a day/week/month.
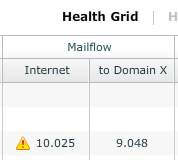
Health Grid
By adding this useful information into your Health Grid dashboard gives you an additional benefit because you can configure your own threshold values (warning / failure thresholds) – besides of the possibility to trigger certain actions (mail, instant messaging) whenever the value is above a certain number
(see the following link for details how you can customize the health grid: http://kbase.panagenda.com/display/GL2KB/Health+Grid+Dashboard+%28Basic%29)

The Mail flow analysis helps you to understand how long a e-mail delivery takes between A and B. Above example shows you the way how you can identify/measure this for Internet e-mails.