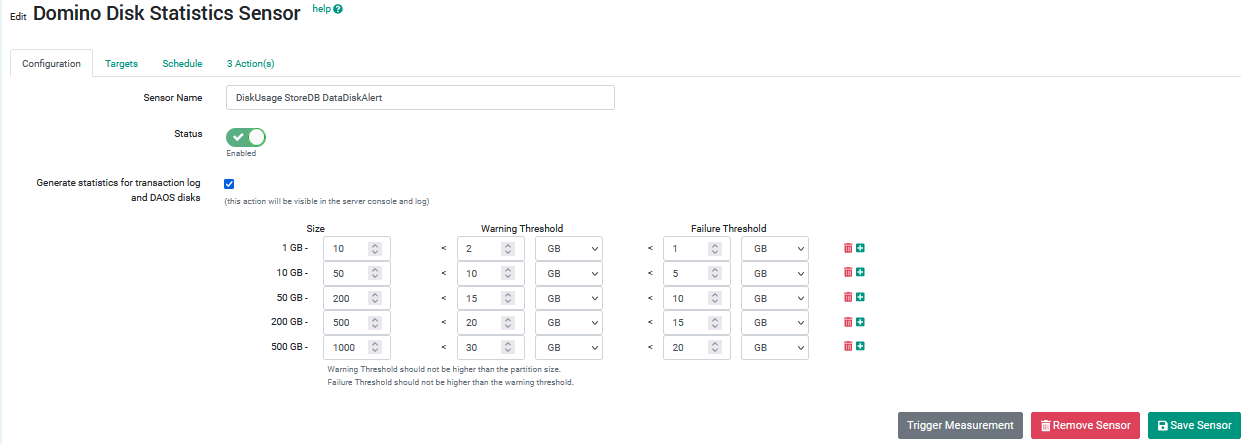
This Sensor allows you to monitor in detail all existing Partitions / Disks and Volumes of the Host itself.
One of the areas which one can monitor is the DAOS and Translog partition.
In order to monitor this , the greenlight notes id needs to have enough privileges to issue remote console commands on the server. If this is not the case you would see on the server console something like
02/13/2017 10:51:45 PM Error issuing remote console command '!show config TRANSLOG_STATUS' from GREENLIGHT-BOT/panagenda: You are not authorized to use this remote console command on this server
02/13/2017 10:51:45 PM Error issuing remote console command '!show config DAOSENABLE' from GREENLIGHT-BOT/panagenda: You are not authorized to use this remote console command on this server
In addition to that one can define size categories for the different disk sizes. So you would assign different warning/failure thresholds to those categories.

e.g. if a disk is 200GB large, then it falls into the third category where the critical failure threshold is set on < 3% of available disk space.
With this kind of configuration you are completely flexible when it comes to alerting.
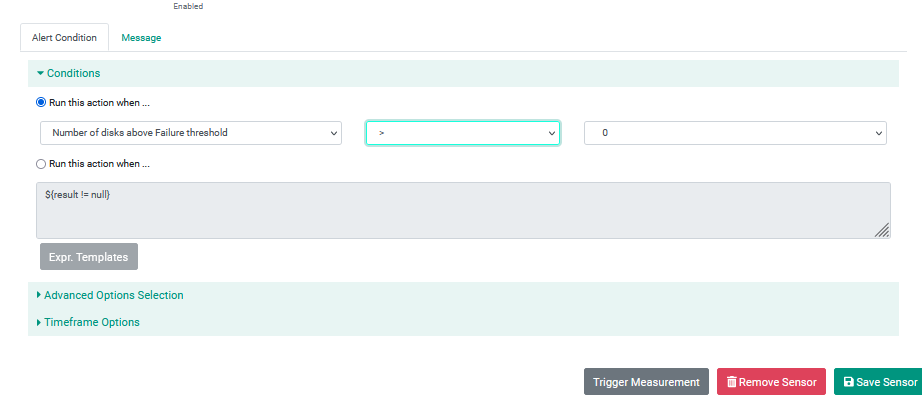
As a condition you could select the following

As a output (e.g mail notifiction) you could use the following expressions
number of disks exceeding ANY of the failure thresholds: ${result.statistics['greenlight.disk.events.failure.count']}
disk label of disks exceeding ANY of the failure thresholds: ${result.statistics['greenlight.disk.events.failure']}