One of the primary goals of GreenLight is to monitor and validate an IBM Traveler environment continuously. The following article should give you a brief overview in which areas GreenLight can deep dive your Traveler Setup.
You are going to find several ideas how you can leverage the power of GreenLight with the data coming from IBM Traveler where visualization and analysis are two important key areas.
Traveler Details
Health Grid
Traveler User Activity
Traveler User Simulation
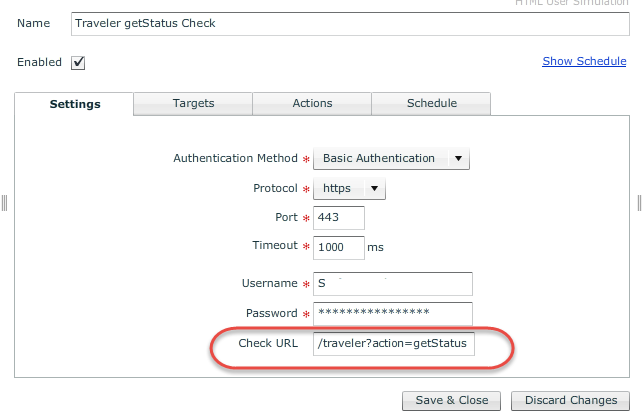
Traveler HTML Simulation for "action=getStatus"
Report
Charting
Alerting
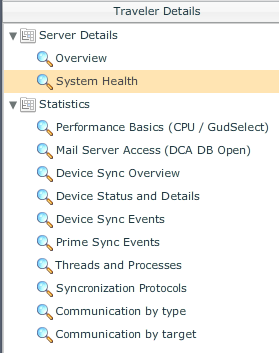
Whenever you have a Domino Statistic Sensor active for a Traveler Server, you are going to get a'lot of Traveler Details
- Double click on a Traveler Server (Health Grid)
- Click on Traveler Details
- The Statistics category provides you with the following output


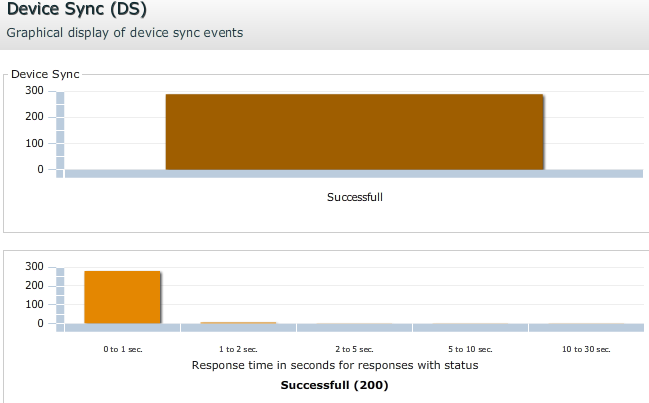
For the "successful" information we make use of the following statistics
Traveler.DeviceSync.Time.Histogram.200.000-xxx
e.g. Traveler. PrimeSync.Time.Histogram.200.000-xxx
Depending on how you have configured your Health Grid you can find relevant Traveler Information there as well. For further information please check out the following kbase article.
IMPORTANT: you can build individual Health Grid Dashboards for each GreenLight User!
http://kbase.panagenda.com/display/GL2KB/IBM+Traveler+-+monitoring+HTTP+threads+vs.+Devices+Total
By using the Traveler User Activity Sensor you get the overview of how many devices have synced/not synced within a certain time period. Having a'lot of devices not synced for more than 2 days indicates clearly that there is an issue from a connectivity perspective.
-Double click on the Traveler Server
-Click on Open Sensor Details
-Click on the Traveler User Activity Sensor
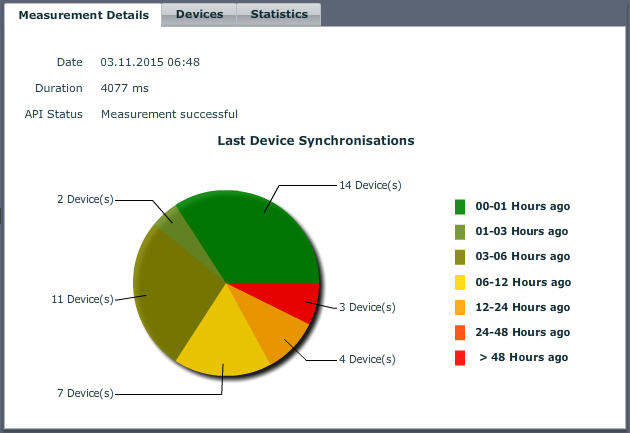
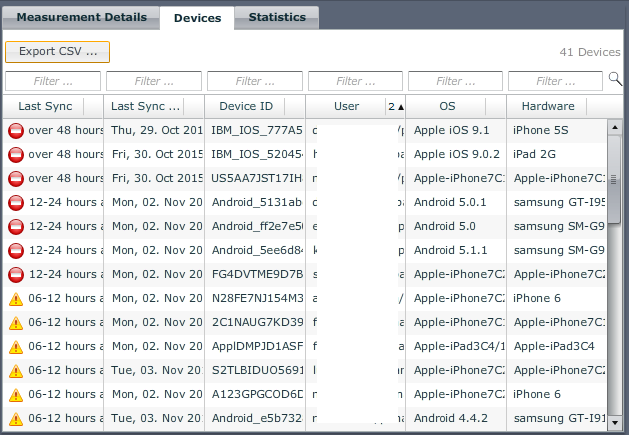
-On the Devices Tab you will find vital information about devices/users/sync state
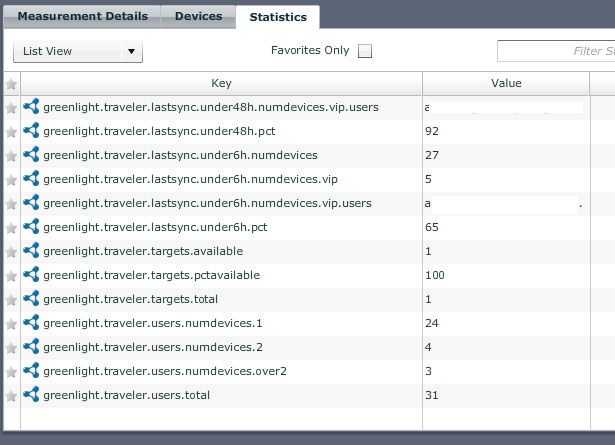
-On the Statistics Tab all important Stats coming from this sensor are listed (vip user info, users total - pool,...)
With the following "simple" example you can simulate and monitor an e-mail delivery to an active mobile device
http://kbase.panagenda.com/display/GL2KB/IBM+Traveler+User+Simulation
With the following End2End Simulation you check if your Traveler environment is accessable/reachable from external.
This single action checks a bunch of things:
By using GreenLight Reports (scheduled or on-demand) you can make use of three different templates.
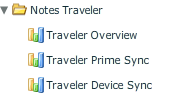
They contain relevant information especially whenever you have internal SLA’s in place
Example: Traveler Overview
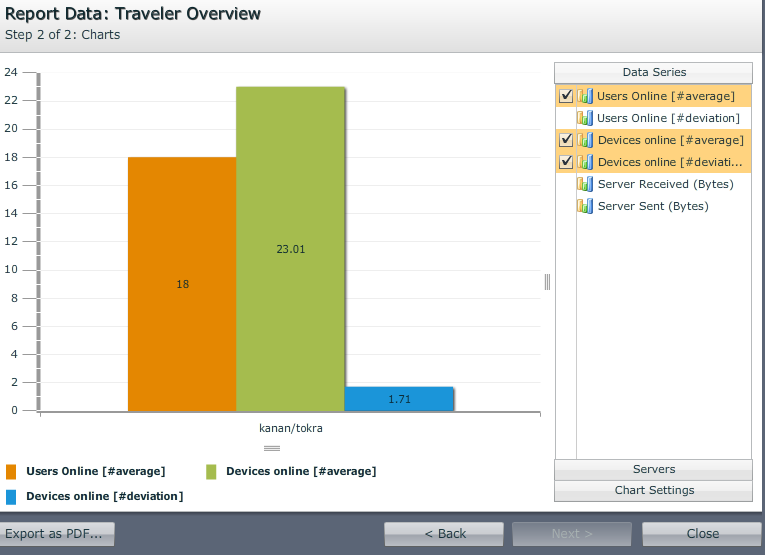
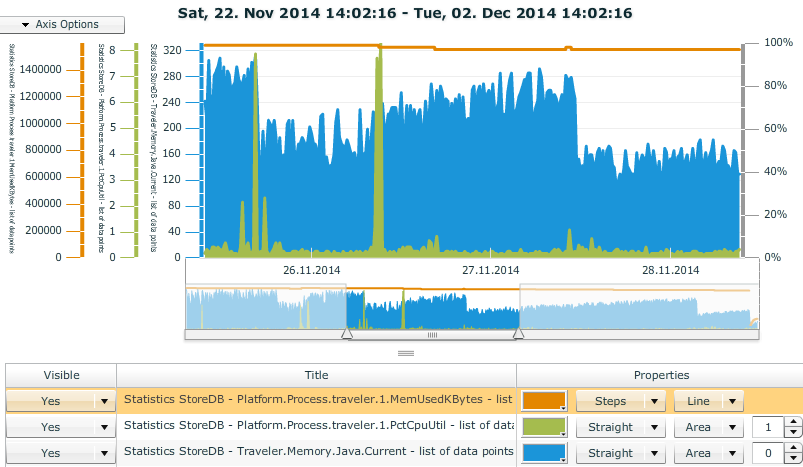
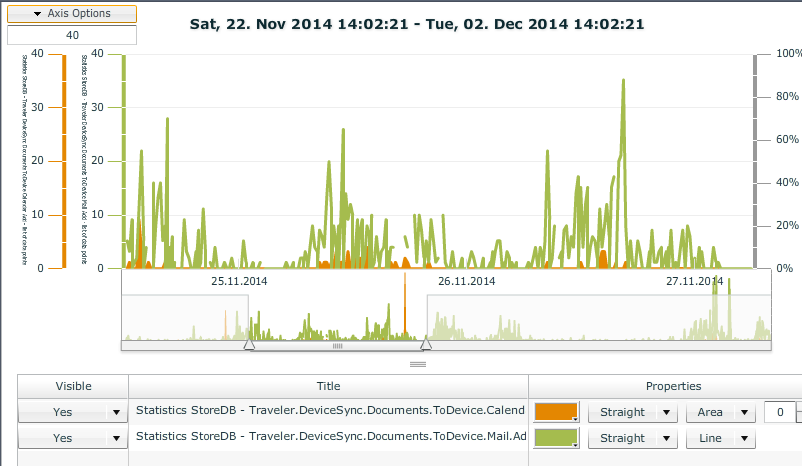
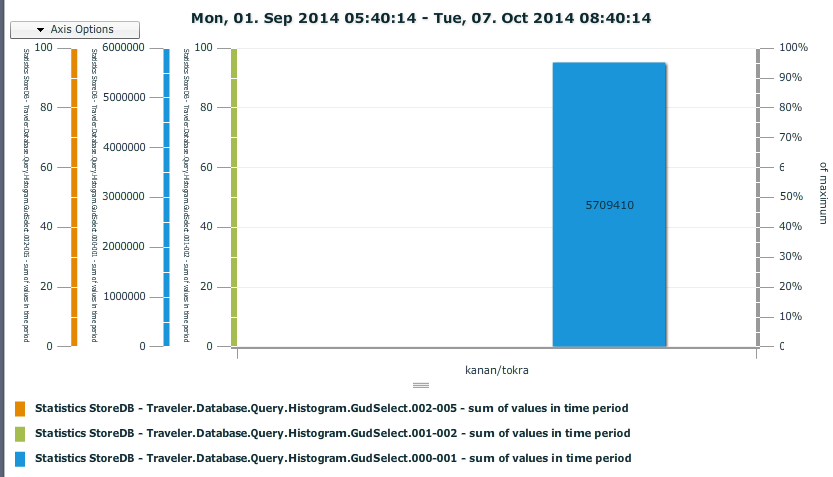
By using the powerful charting engine of GreenLight, you can generate whatever chart you want/wish. For instance: Line-charts to cover CPU utilization. Bar-charts to cover different Histograms of IBM Traveler
Find below some Ideas of Charts (if you need detailed information of what parameters i have used for those charts, feel free to let us know)
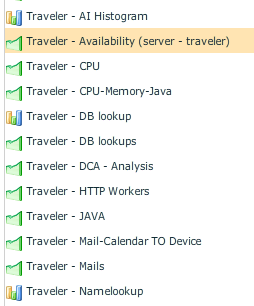
Examples
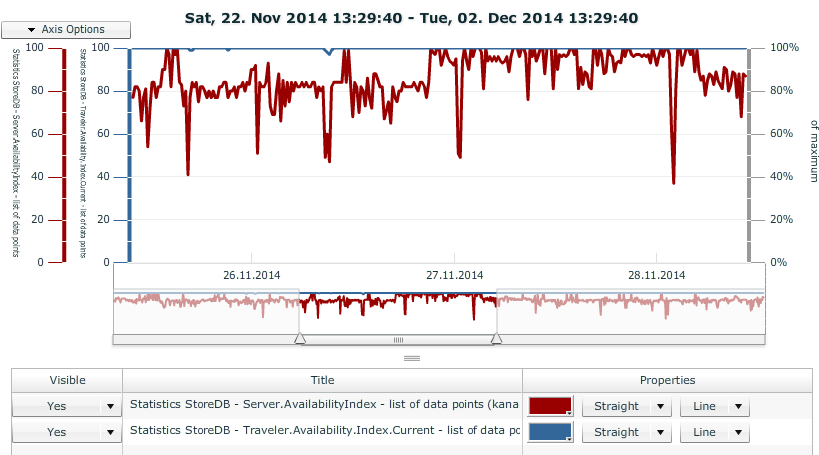
Traveler Availability (Domino Server Availability vs. Traveler Availability)
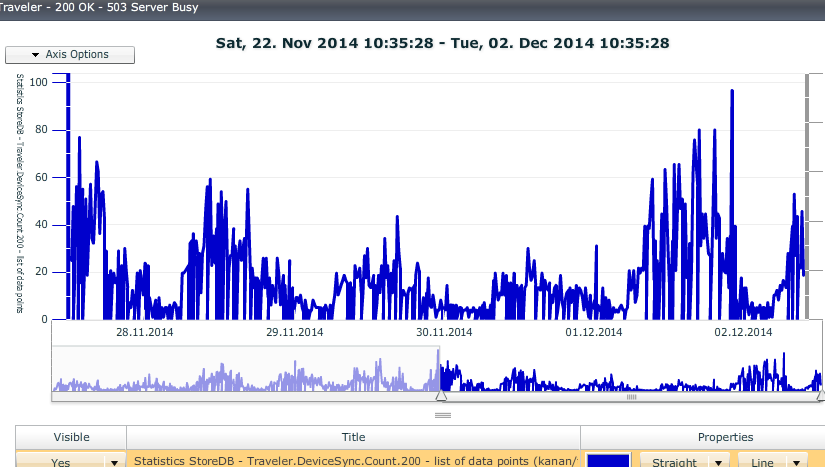
Successful Device Syncs (200) vs. Server busy (503)
CPU Utilization vs. free memory vs. Traveler.Memory.Java.Current
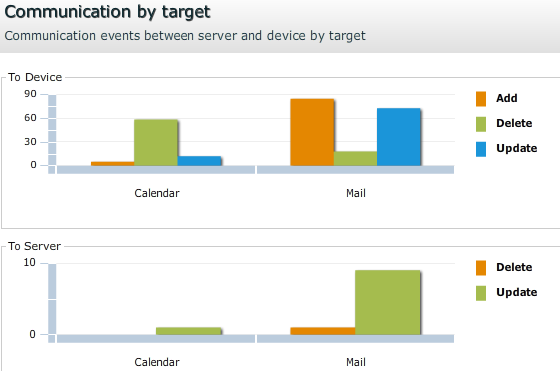
Calendar docs vs. Mail docs TO Device
Histogram of DB queries
You can utilize ANY Traveler Statistics for your notifications. To give you just one powerful example, checkout the following kbase article:
http://kbase.panagenda.com/display/GL2KB/Action+Example+-+http.workers+vs.+devices
You can imagine what other Usecases exists
A'lot of Information can be used for monitoring/analyzing an IBM traveler setup.