Page History
This dashboard provides a comprehensive overview of the selected managed network and serves as an initial point for further analysis.
Currently, its primary focus is on Teams calling elements, however, additional features will be incorporated over time.
Benefits of using the Page ?
- Determine the extent of Teams Calling issues on the network.
- Identify the most affected media type (A/V/VBSS).
- Check for the implementation of best practices such as TCP usage or non-standard audio ports.
- Get instant access to all calls made on the network during the chosen timeframe.
What
It is important to note that call counts on that page are based on established thresholds.
Type | Threshold |
|---|---|
Audio Jitter | > 30ms |
Audio Rtt | > 200ms |
Audio Loss Rate | > 5% |
Video Rtt | > 200ms |
Video Loss Rate | > 5% |
VBSS Loss Rate | > 5% |
Memory | > 90% |
Cpu | > 90% |
Wi-Fi Signal | < 70% |
And there are 3 key aspects:
• Aggregated Figures from the selected time range
• Time range will be capped at 14d maximmum
• Numbers are counted as "User Calls"
Components on Page
KPIs
The KPI Grid gives an overview at a glance.
Tiles appear in grey for general information, blue if there are no issues, and orange when a user call matches a problem type.

Timelines
There are three timelines in a sequence to quickly identify patterns.
- The first one depcits the number of users calls per hour.
- The second timeline shows the number of user calls where an media category (Audio/ Video / VBSS) was flagged as impacted as a stacked barchart
- The third one maps the individual findings (insights/issues) on the timeline.

Different Perspectives (Group by)
This section provides three different groupings based on the Numbers from above
- By Teams Version
- By Device Type
- By Operationg System

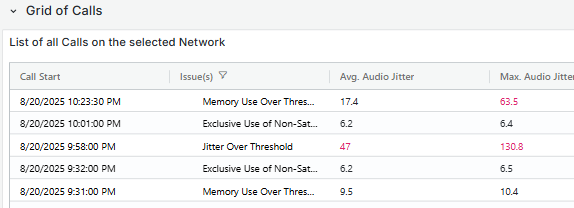
Grid of Calls
This grid displays call records made by individual users on the network, presenting key information for each entry. Selecting a row redirects to the Call Debug Page, where detailed user data can be accessed.