Page History
...
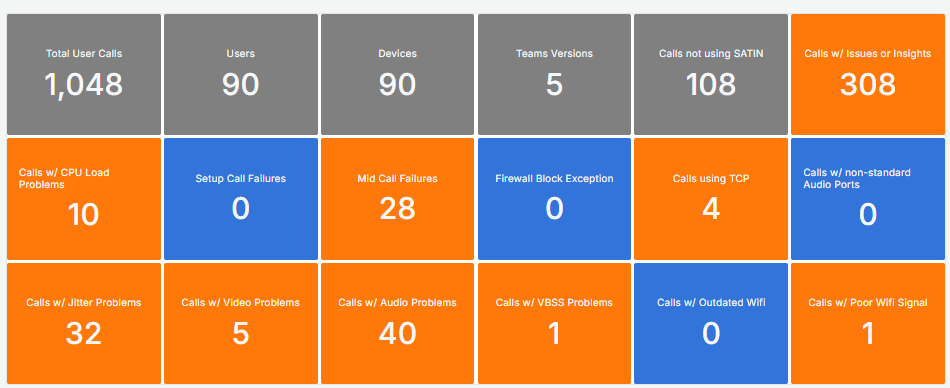
It is important to note that call counts on that page are based on established thresholds.
| Code Block |
|---|
Audio Jitter > 30ms Audio Rtt > 200ms Audio Loss Rate > 5% Video Rtt > 200ms Video Loss Rate> 5% VBSS Loss Rate> 5% Memory > 90% Cpu > 90% Wi-Fi Signal < 70% |
And there are 3 Three key aspects to consider:
• Aggregated Figures from the selected time range
• Time range will be capped at 14d maximmum
• Numbers are counted as "User Calls"
...
The KPI Grid gives an overview at a glance.
Tiles appear in grey for general information, blue if there are no issues, and orange when a user call matches a problem type.

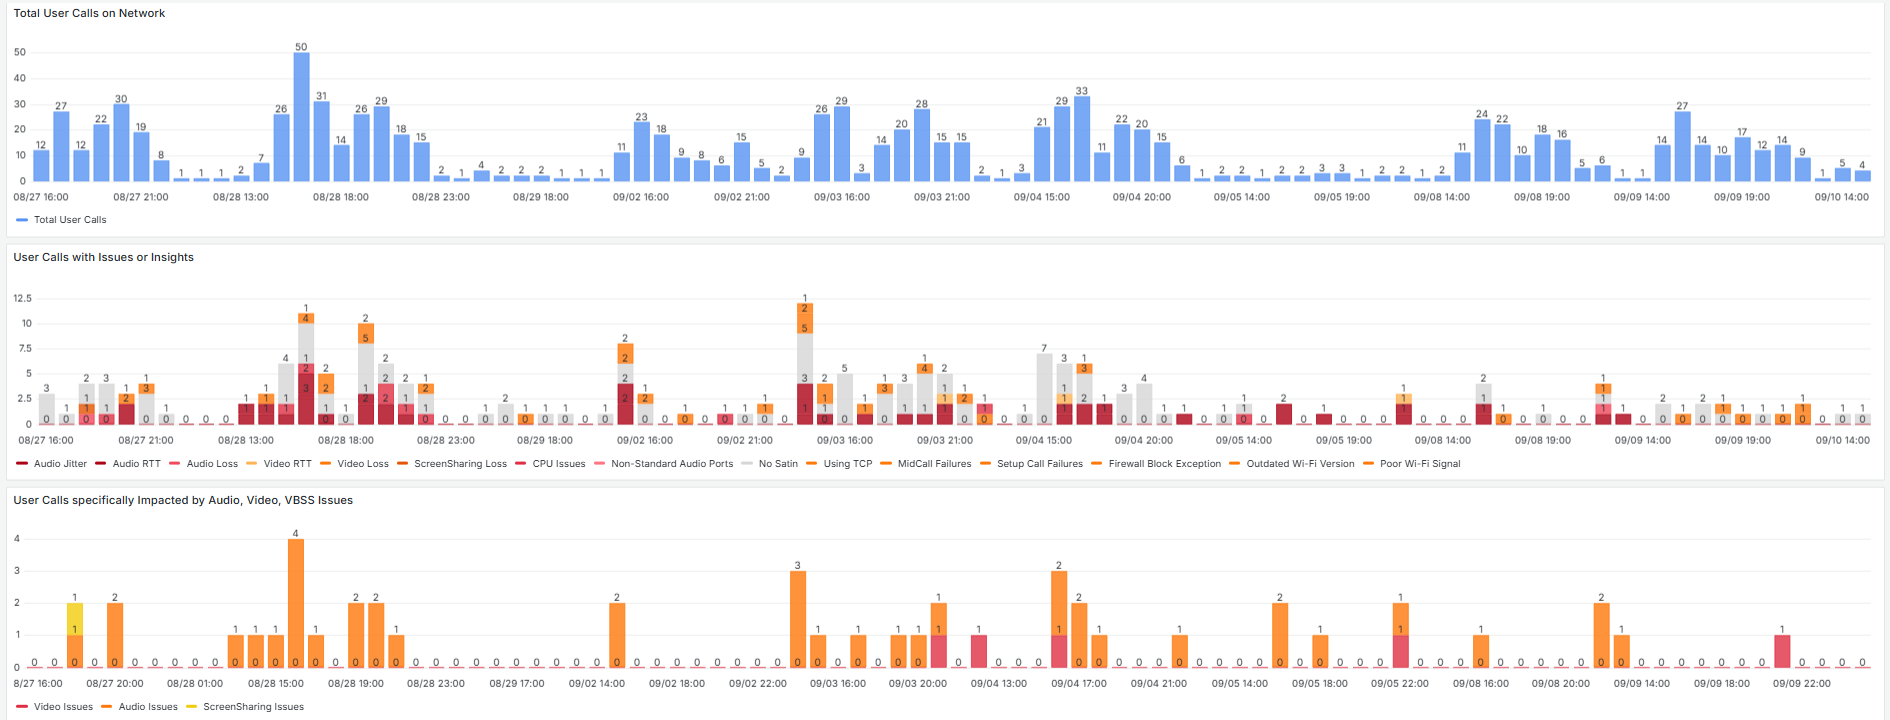
Timelines
There are three timelines in a sequence to quickly identify patterns.
- The first one depcits the number of users calls per hour.
- The second one maps the individual findings (insights/issues) on the timeline.
- The third timeline shows the number of user calls where an media category (Audio/ Video / VBSS) was flagged as impacted as a stacked barchart
- The third one maps the individual findings (insights/issues) on the timeline.

Different Perspectives (Group by)
...
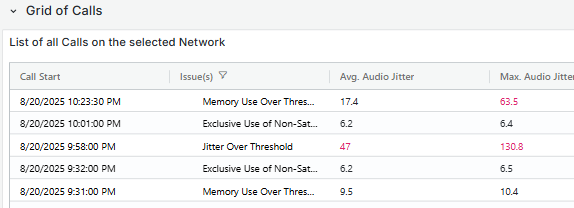
This grid displays call records made by individual users on the network, presenting key information for each entry. Selecting a row redirects to the Call Debug Page, where detailed user data details about the Call can be accessed.