![]()
Page History
...
The Complexity page lists the overall totals of all analyzed designs in your application landscape when it comes to focus databases.
- Number of focus databases analyzed
- Total number of lines of code – use the mouse-over to see a breakdown in terms of used coding language
- Average complexity index
- Highest complexity index
The average & highest complexity index give you an idea of the spread of complexity. By looking at the efforts and costs of transformation or modernization of a low complexity, an average complexity and a high complexity database you can get an impression of time and effort needed to perform the actions you can give yourself a starting point to do calculations for planning and investment. Combining this with other information (like usage) allows you to extrapolate that over your entire environment.
Source Code
In this view, details about the used source code are displayed:
- Number of focus databases analyzed
- Number of design documents
- Total number of lines of code – use the mouse-over to see a breakdown in terms of used coding language
- Number of code blocks
- Code duplication rate
Additionally, this page gives you insights into the prevalence of the various coding languages used, the number of design elements and the number of code lines represented by those design elements.
At the bottom of the page you see a distribution overview of all databases with a complexity index of High, Very High or Exceptional.
Source Code
TBD
Similarity
The Similarity tab is where you will be able to identify database that share a design but not necessarily a template, or designs and/or templates that are so similar that it could be beneficial for optimization and modernization to consolidate them into one single template.
...
The bubble color is determined by the average similarity score inside a cluster. The higher the similarity the darker the bubble. The exact percentage is also displayed as text if bubble size allows.

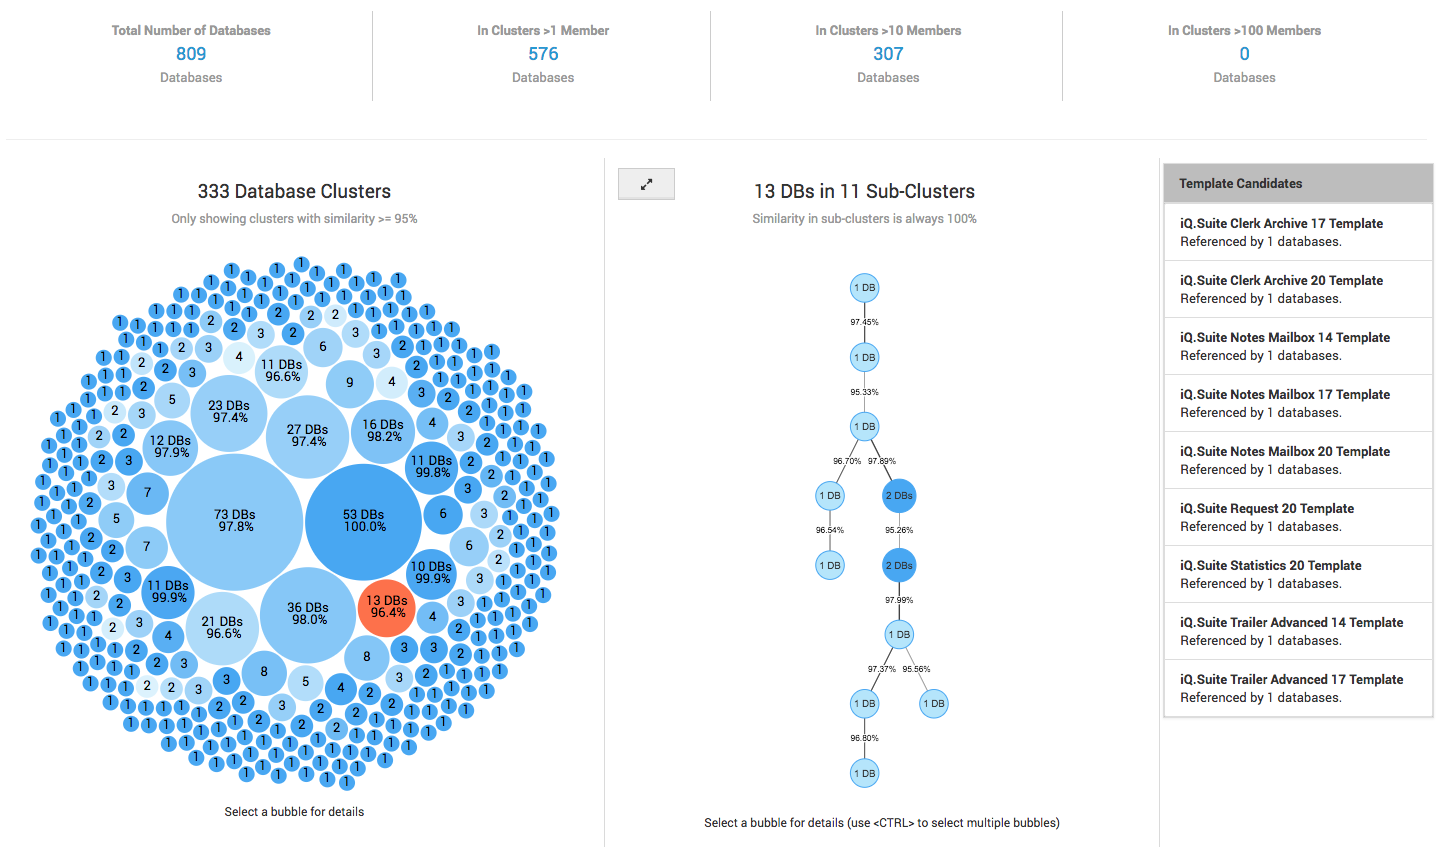
Similarity Cluster details:
...
These findings are categorized into the following rulesets:
- Web Design
- Mail DependenciesDac
- Special Interfaces
- Operating System Dependencies
- Dependencies On Other Databases
- Specific Code Findings
- Custom rulesets as defined by your own organization
All these various categories of findings are then listed in the "Design Insights – by Ruleset and Findings" graph. To focus in on a certain ruleset simply click on it to expand it for better overview. To collapse it back to the overview simply click on the button in the right upper corner.


The color of each finding indicates its relative impact (Dark red being severe and green being low).
...