The Design section of panagenda ApplicationInsights gives you global information about the design complexity and details of your application landscape.
In this topic:
Complexity
The Complexity page lists the overall totals of all analyzed designs in your application landscape when it comes to focus databases.
The average & highest complexity index give you an idea of the spread of complexity. By looking at the efforts and costs of transformation or modernization of a low complexity, an average complexity and a high complexity database you can get an impression of time and effort needed to perform the actions you can give yourself a starting point to do calculations for planning and investment. Combining this with other information (like usage) allows you to extrapolate that over your entire environment.
Source Code
In this view, details about the used source code are displayed:
- Number of focus databases analyzed
- Number of design documents
- Total number of lines of code – use the mouse-over to see a breakdown in terms of used coding language
- Number of code blocks
- Code duplication rate
Additionally, this page gives you insights into the prevalence of the various coding languages used, the number of design elements and the number of code lines represented by those design elements.
Similarity
The Similarity tab is where you will be able to identify database that share a design but not necessarily a template, or designs and/or templates that are so similar that it could be beneficial for optimization and modernization to consolidate them into one single template.
To do so, panagenda ApplicationInsights analyzes the designs of each of your focus databases and compares them. Both on design elements as well as on individual code line
level. Databases that share at least 95% or more similarity with each other are then grouped into 'similarity groups'. Independently of whether they share a design template or not.
Overall Similarity insights:
The top bar of the Similarity page shows indicators for the number of database instances that can be found in clusters >1 member, >10 Members or >100 members. Where a cluster is a group of database instances that share a >95% similarity to each other. A first indicator of the potential impact of template consolidation.
Similarity Cluster distribution:
Below that a graph will show you the various identified similarity clusters (the number of clusters is listed above). Larger bubbles represent larger clusters (more database instances sharing the same similarity) and smaller bubbles represent situations where only two or a few database instances are involved.
The bubble color is determined by the average similarity score inside a cluster. The higher the similarity the darker the bubble. The exact percentage is also displayed as text if bubble size allows.
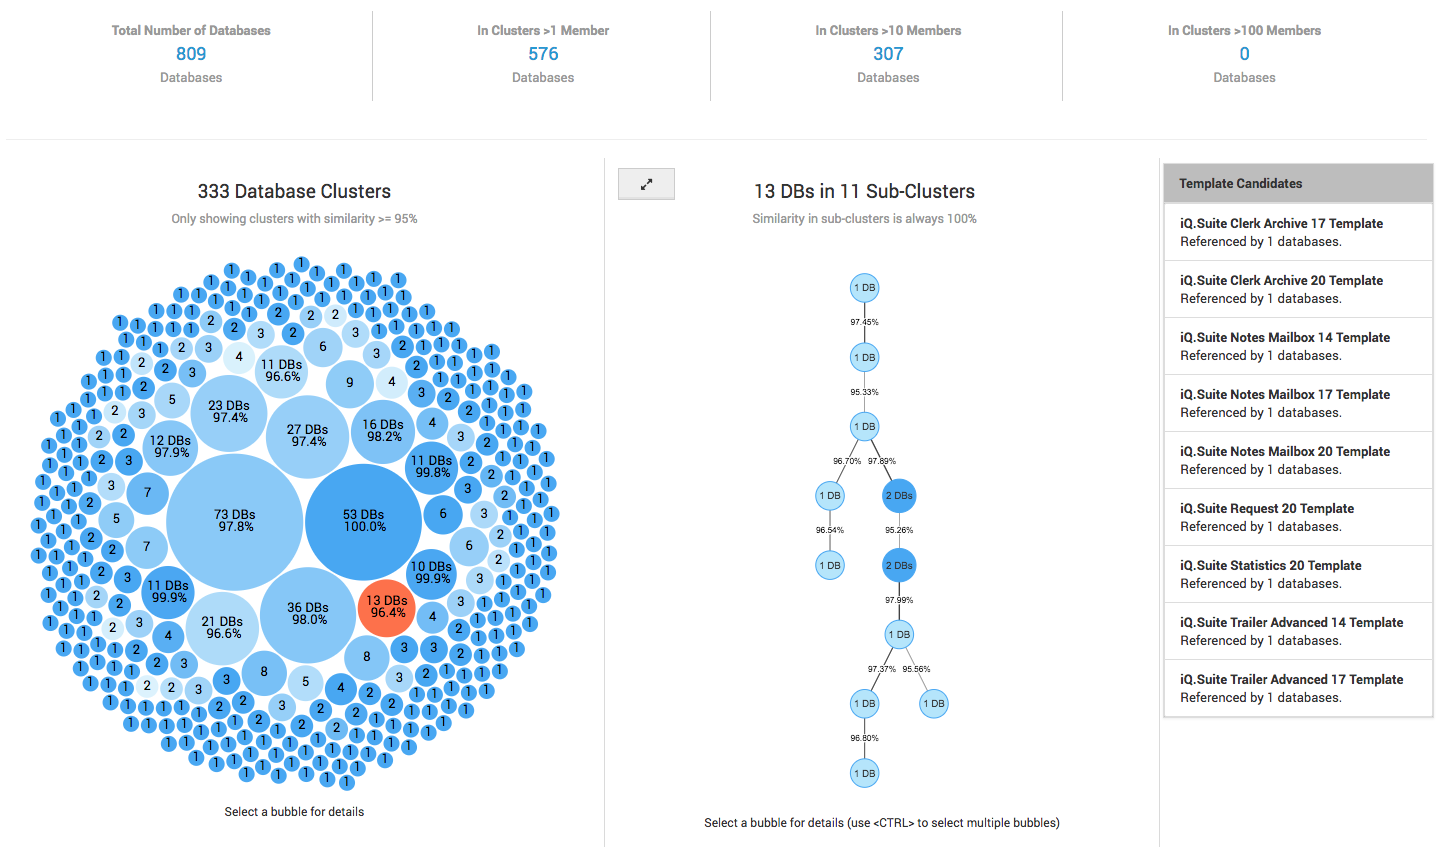
Similarity Cluster details:
By clicking on a cluster bubble a second column will appear holding a node diagram representing that cluster's structure. Each node in this diagram represents a sub-cluster of 1-n database instances that share a unique design with 100% similarity score, with the size and number on the node representing how many instances share that same unique design. Links between nodes show the percentage of design similarity between sub clusters.
In the third panel on the right-hand side potential Template candidates are shown for the whole cluster, including the number of databases already inheriting from this template.
Instance and template identification:
To get more information about the database instances represented in each node, simply click on a node. The third column of information will then show a list of instances represented by the selected node. For each instance the title, location and template name are shown so that you can quickly identify if these instances indeed inherit from a shared design or perhaps should do so.
You can select more than one node at a time by holding the CTRL key on your keyboard. To see an individual instances full details and design insights simply click on its title in the third column.
By using this page, you should be able to quickly identify which database designs within your environment can be consolidated and optimized, which databases should be assigned to a template and what the impact will be when performing template consolidation.
Insights
The Insights page gives you information about the designs found containing insights ("Findings") based on the rulesets. Here too you see information about the number of lines of code (and on mouse-over their distribution across various coding languages) but you also see the number of databases that have findings and information about the total number of findings found.
A finding is where a specific code element or combination of code elements was found that is listed as something that requires consideration in case of for instance modernization. Think of things like dependencies on other databases, operating system or rich client but also old code, code not supported on the web and mail dependencies.
These findings are categorized into the following rulesets:
- Web Design
- Specific Code findings
- Mail Dependencies
- Operating System Dependencies
- Special Interfaces
- IBM Cloud Readiness
- Dependencies on other Databases
- Custom rulesets as defined by your own organization
All these various categories of findings are then listed in the "Design Insights – by Ruleset and Findings" graph. To focus in on a certain ruleset simply click on it to expand it for better overview. To collapse it back to the overview simply click on the button in the right upper corner.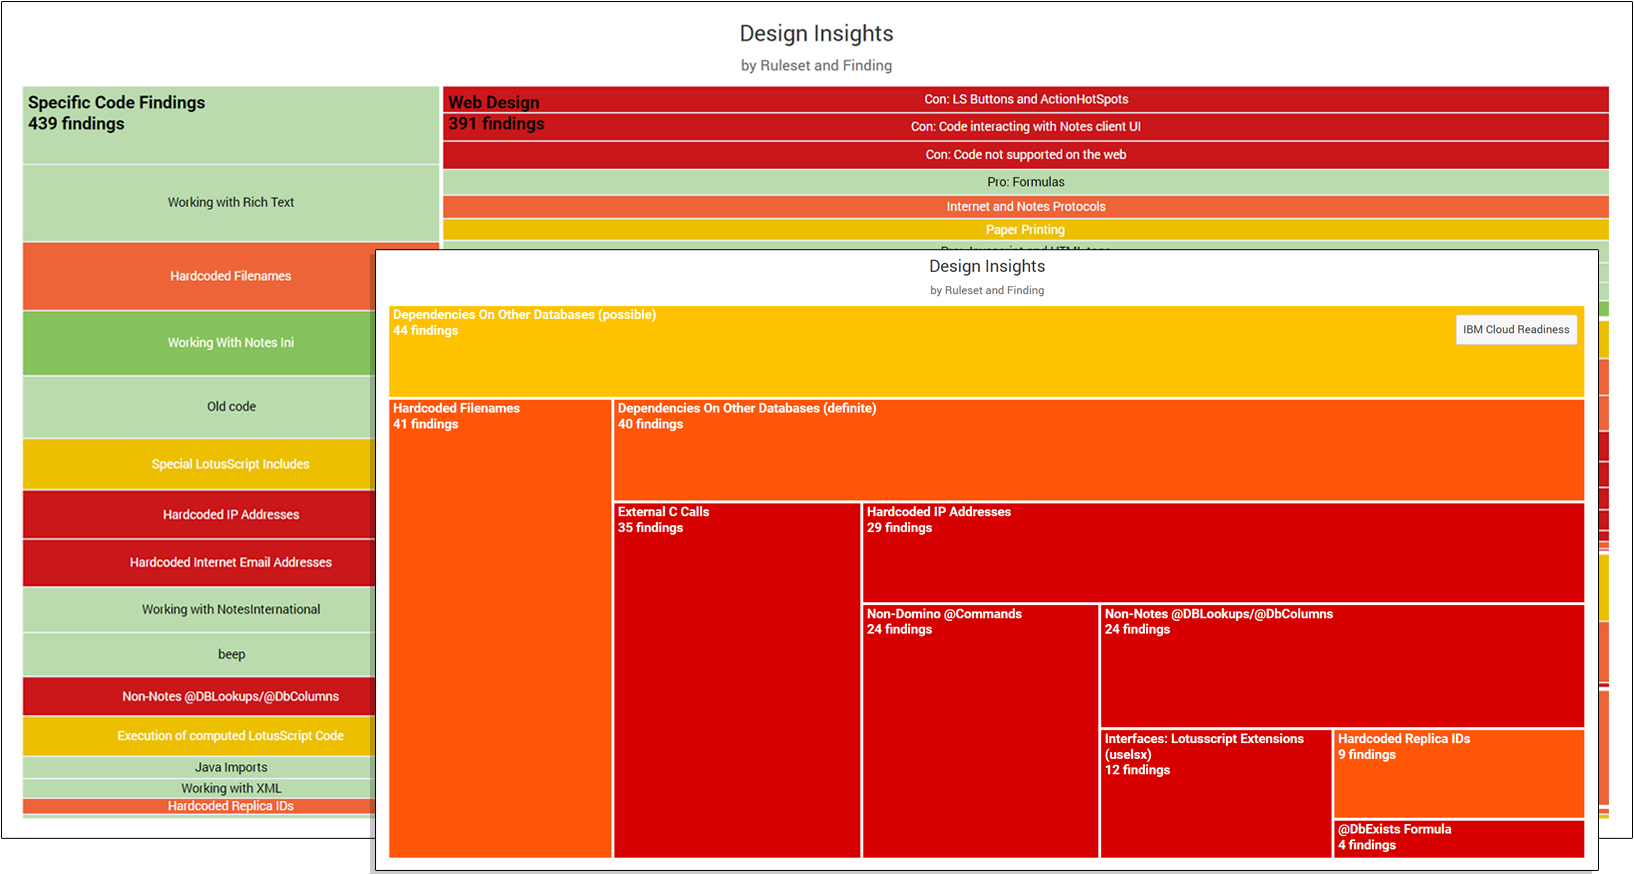
The color of each finding indicates its relative impact (Dark red being severe and green being low).
The distribution of the different ruleset categories as well as the findings within them give you an insight into the type of potential roadblocks or focus areas in case of design changes you might face. To see which databases are within each ruleset use the Catalog view and sort them based on the various "Insights" column sets.