Page History
...
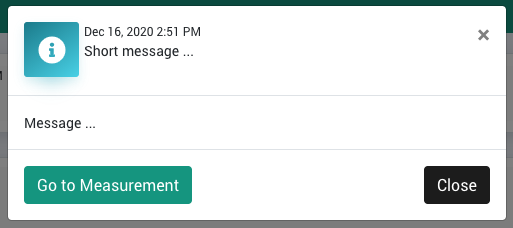
Clicking on a message opens a pop up with more details. Click on the Go to Measurement button in this pop up to open the respective measurement in the Sensor Overview:
Grid
TBD
...
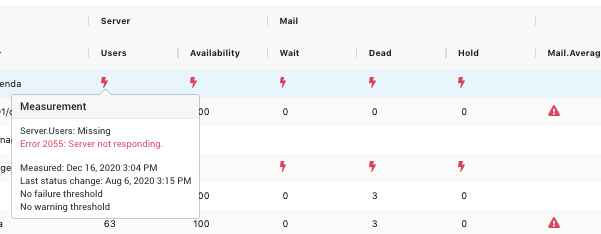
 In the Grid section you will see a list of your servers with the corresponding measurements:
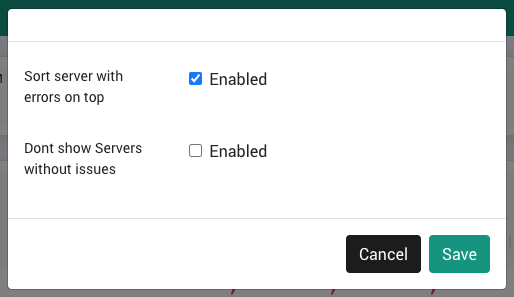
Clicking on the cogwheel icon offers you some basic display options:
Sorting and Filtering
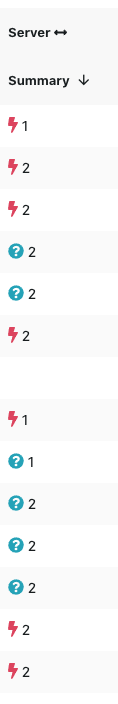
The measurements are grouped by categories, e.g. "Mail" or "Server", which further split into, e.g. "Wait" / "Dead" / "Hold" or "Users" / "Availability". Clicking on such a category, summarizes the individual measurements, as shown on the following screenshot for "Server":
You can sort columns by clicking on the name, e.g. "Summary" on the screenshot above - the arrow shows whether the sorting is ascending or descending; clicking toggles between these options.
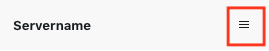
The Servername