This page gives you a quick overview about the health status in your environment configuration and is therefore displayed per default after the login (unless you have defined a dashboard as the homepage, see Dashboard).
It divides into two main sections:
Live Ticker
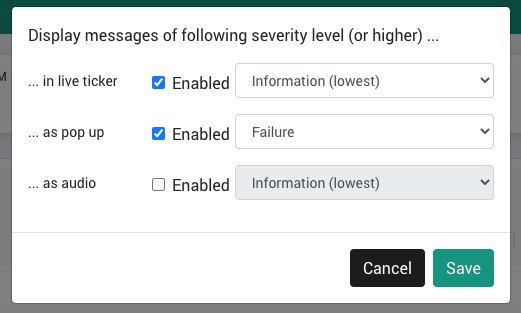
Here you will see the live messages for all severity levels (default setting). You can adjust these settings by clicking on the cogwheel icon:
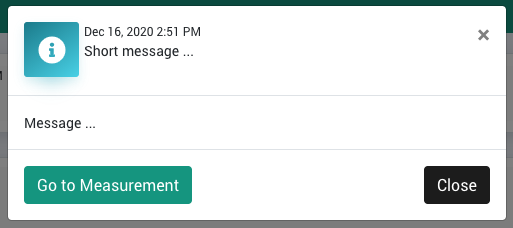
Clicking on a message opens a pop up with more details. Click on the Go to Measurement button in this pop up to open the respective measurement in the Sensor Overview:
Grid
In the Grid section you will see a list of your servers with the corresponding measurements:
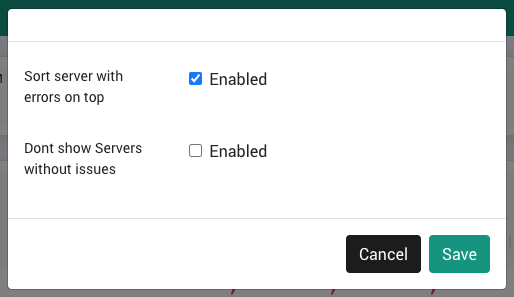
Clicking on the cogwheel icon offers you some basic display options:
Sorting and Filtering
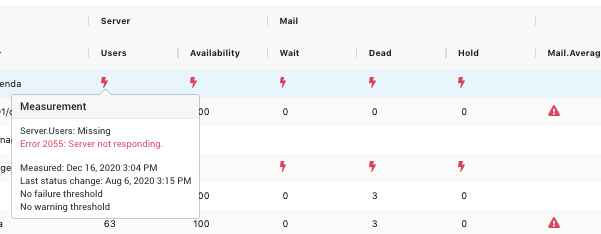
The measurements are grouped by categories, e.g. "Mail" or "Server", which further split into, e.g. "Wait" / "Dead" / "Hold" or "Users" / "Availability". Clicking on such a category, summarizes the individual measurements, as shown on the following screenshot for "Server":
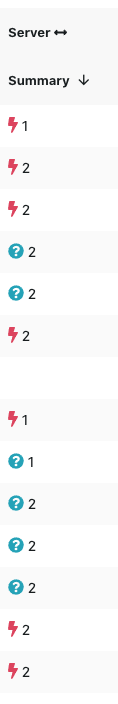
You can sort columns by clicking on the name, e.g. "Summary" on the screenshot above - the arrow shows whether the sorting is ascending or descending; clicking toggles between these options.
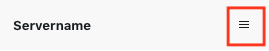
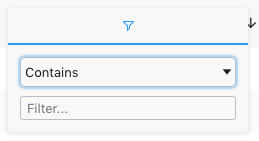
The Servername column can be filtered - clicking on the following icon opens the filter dialog (hover your mouse over the column heading to display the icon):
Data Analysis
The right click menu opens several options to further dive into the data:
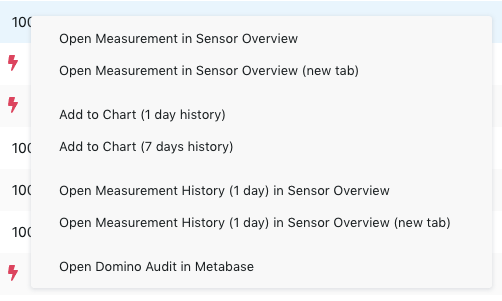
The Add to Chart... action opens an ad-hoc chart directly within the Health Grid.
If Domino Audit is selected, Metabase will be opened in a new tab. The credentials can be found in this article: Metabase Default Users.