Page History
...
There are several kinds of gadgets you can add to your dashboaddashboard:
GRID
When choosing this option (from the Add gadget button) you will see a drop down list of your preconfigured Grids. Select the one you wish to see on your dashboard and hit the Add button.
...
You will be asked to name the chart, then click on save.
Metabase
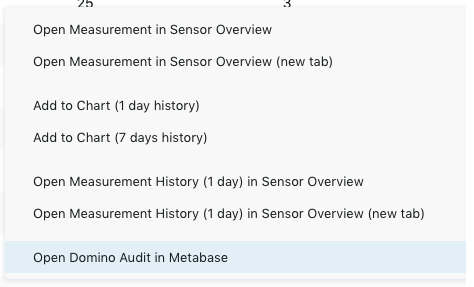
- Check Context Menu Options
NOTIFICATIONS BAR
This selection adds a notification bar, which you may already know form the Health Grid, to your dashboard.
...
- Qick overview for domino server
- select server (preview) - prerequisites (sensors): Domino Statistics/Domino Availability/Domino DB Access (CONFIG ERROR, if one is missing) - save
ADD Charts:
- On-demand chart from grid
- Plus Icon to add it to dashboard
Charts von Dashboard: Nur letzte 7 Tage (Metabase)
Adjust size, location (video https://www.panagenda.com/kbase/display/gl/How+to+build+a+Dashboard+-+example+1)
Save Icon!
Customization
Default (for user) --> Star Icon (statt health grid)
Cogwheel (Name, public)
- Check Context Menu OptionsAdjust size, location (video How to build a Dashboard - example 1)