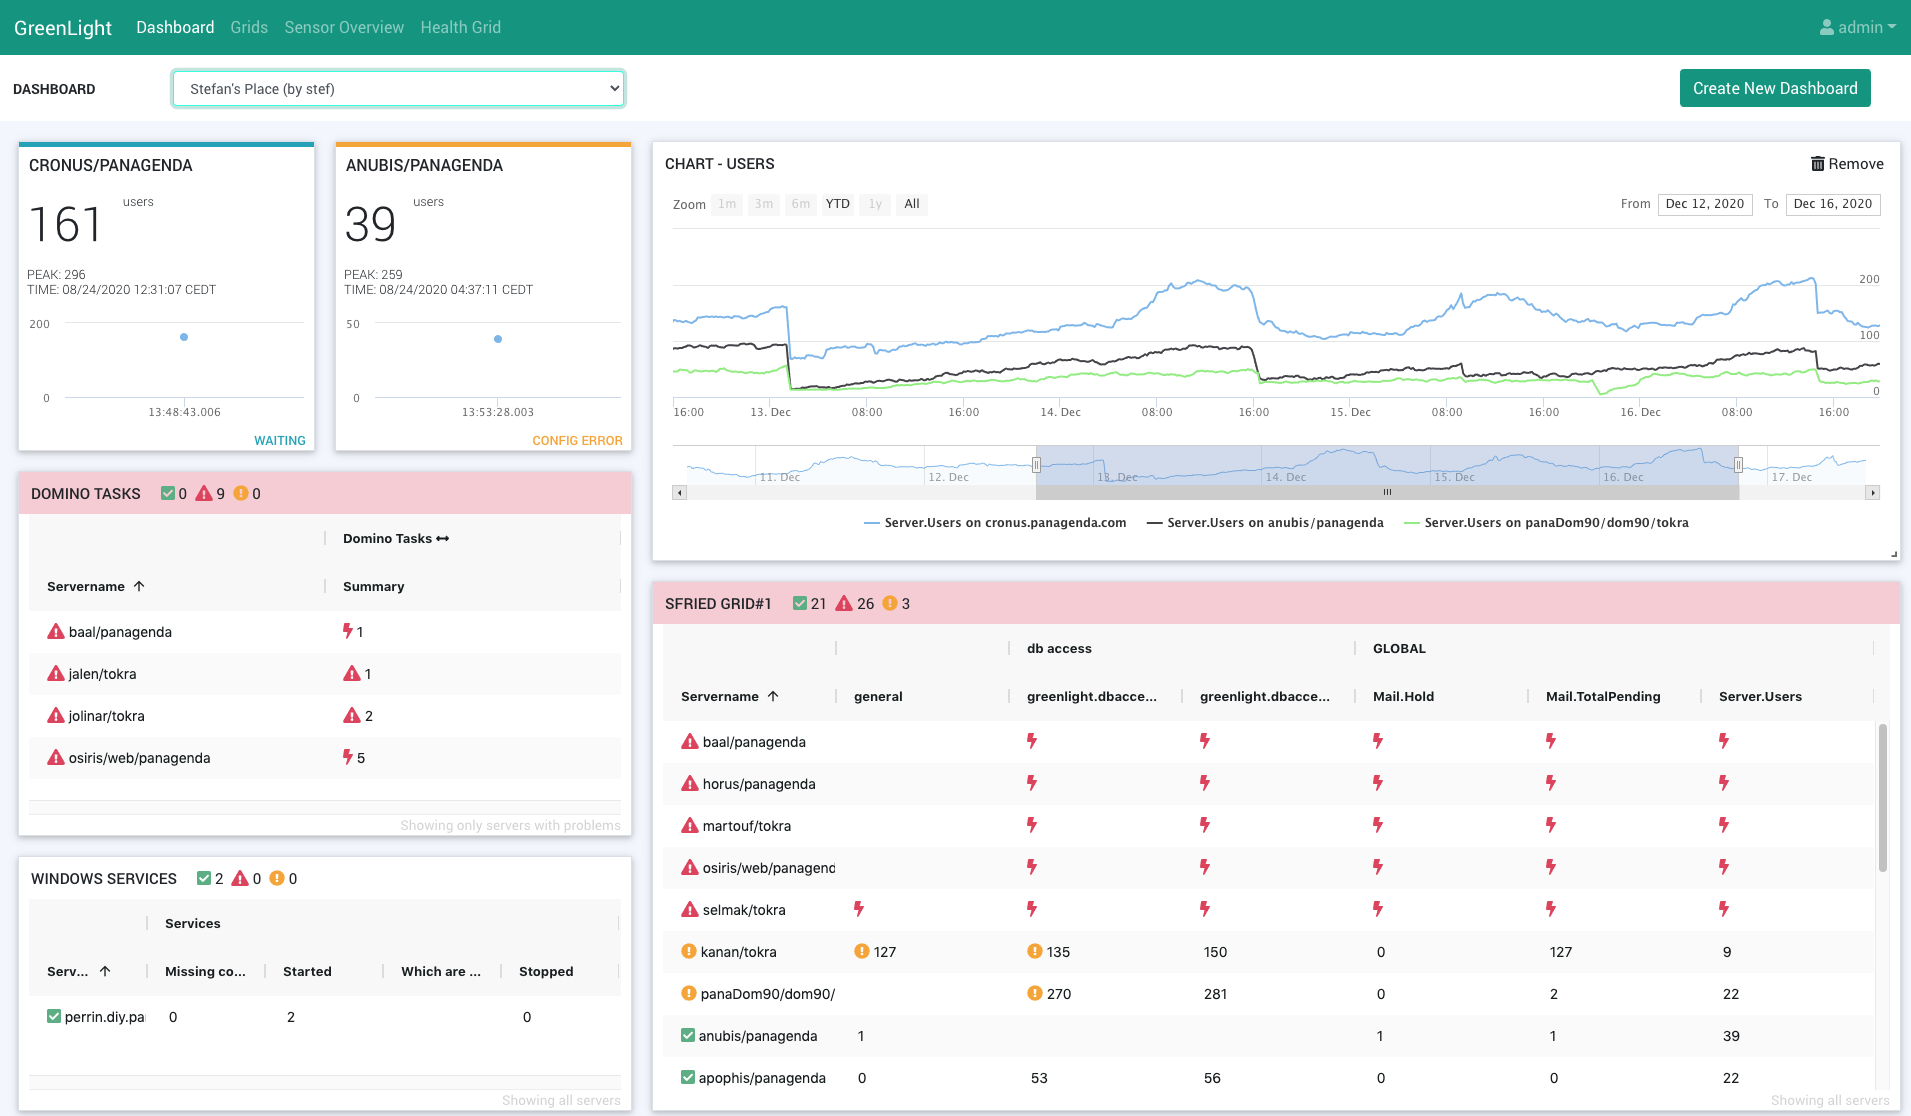
Dashboards enable you to customize GreenLight infrastructure monitoring to suit your individual use cases. We recommend to prepare the information in Grids before you create Dashboards.
Contents:
Create New Dashboard
After clicking this button, a popup will appear where you can set the name of your dashboard and whether it should be available for all users (= public enabled) or only for you.
There are several kinds of gadgets you can add to your dashboard:
GRID
When choosing this option (from the Add gadget button) you will see a drop down list of your preconfigured Grids. Select the one you wish to see on your dashboard and hit the Add button.
Based on these grids, you can create ad-hoc charts or you can create a chart and add it to the dashboard permanently. To do so right click on a measurement in the grid and select Add to Chart... from the context menu. An ad-hoc chart will be created which can then be added to the dashboard by clicking on the green + icon next to "MEASUREMENT HISTORY" in the popup header bar:

You will be asked to name the chart, then click on save.
In addition to charts, there are further options available from the the context menu in order to take a closer look at the grid data:
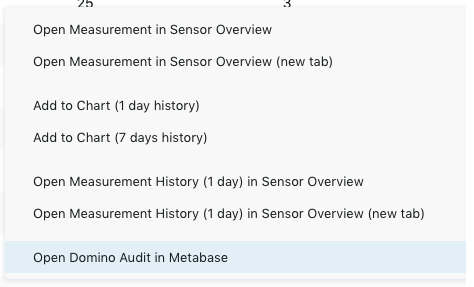
Please refer to this page for more information on Metabase.
NOTIFICATIONS BAR
This selection adds a notification bar to your dashboard, which you may already know form the Health Grid.
DOMINO SERVER CARD
This widget gives you a quick overview of selected Domino servers. If you select a specific server, you will see in the preview whether all required sensors are configured for this server (Domino Statistics/Domino Availability/Domino DB Access) in order to have all information available this widget provides. The widget will display "CONFIG ERROR" in case one or more sensors are not configured. Click the save button to add a Domino Server Card to your dashboard.
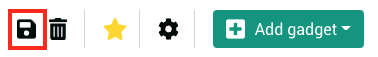
Do not forget to click on the save icon when you are done with creating your dasboard!
Customization
All elements on your dashboards can be adjusted in size and space (as also shown in the explainer video How to build a Dashboard - example 1):
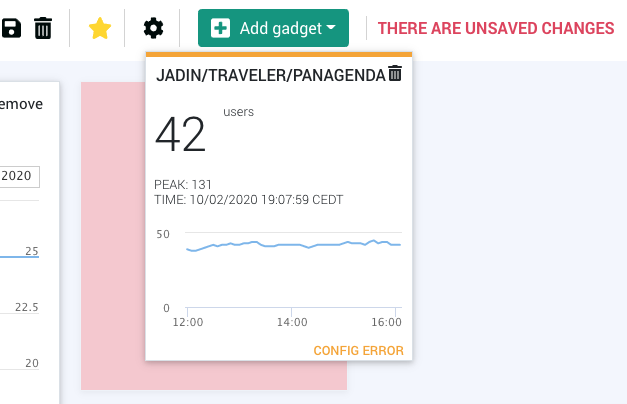
Move your mouse to the header bar of elements for repositioning.
In case you see the following icon in the bottom right edge, the size can also be adjusted:
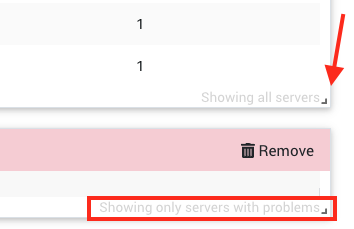
As you can also see on these screenshots above, grids inform you whether all servers are shown or only those with problems.
Furthermore you can set dashboards as homepage by hitting the star icon - if one is defined it will be shown after login instead of the Health Grid.
Clicking on the cogwheel icon enables you to edit the name of the dashboard as well as toggling the public availability (for all users) of this dashboard.
Do not forget to click on the save icon when you are done with your customization!