![]()
Page History
The Catalog section of panagenda ApplicationInsights is where you can get deep dive information about a specific database instanceinstances and servers. Both in terms of usage as well as design.
...
...
In this topic:
| Table of Contents |
|---|
Working with the Catalog
...
Instances
...
Listed
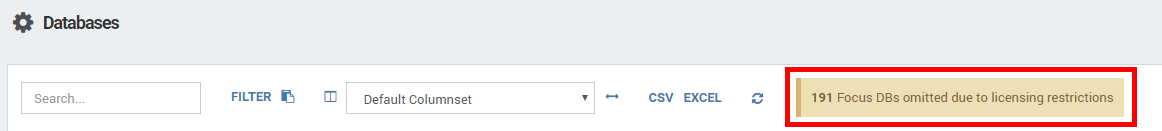
 The catalog list Databases view lists all instances your license entitles you to access for analysis and allows you to easily filter, search, export and compare information for the analyzed databases. Please review the paragraph on licensing . Please review Licensing & Entitlement to understand how the selection of instances you see is made. As this list displays instances, it is possible that you see several instances of the same replica set.
Displayed number of lines:
The "Show entries" option in the top left allows you to show more or less values per page.

Displayed columns:
The "Columns" option in the top right allows you to select one of the column sets. The "Default" set contains information like the location, the type of instance and the impact score.

The "Usage" set show information about the number of sessions and the types of access (mobile, web or Notes client) as well as some design information.
The "Scores" set shows you, among others, information about ranking and scores for complexity, insights and impact.
The "View Characteristics" set shows information about number of views, used views and code used in views.
The "Code Languages" set shows info about used types of code in code elements.
The "Core Design Elements" set shows Number and types of design elements that contain code.
The "Insights" sets give you specific filter options to select databases with similar ruleset findings.
The "Insights <ruleset>" views give you the option to see all findings for each of the rulesets (including self-created ones) in a table list for export and analysis.
...
(for further details, please see Definitions).
Search
Use the search field to find certain database instances or servers:

Sorting & Filtering
To find a specific instance or server you can also sort the list on various elements. For example, on the name of the database, the server the instance is located on, or even on a type or impact score complexity score if you are interested in finding databases of a specific type or complexity. To sort simply click on the column header. 
Alternatively, you can also filter the list on any of the columns by clicking the "funnelBurger" icon in the top. The column headers will then become fields where that appears when hovering the mouse over a column an then clicking on the filter icon:
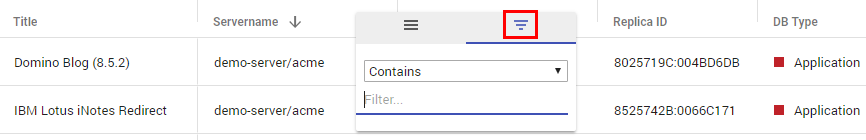
In the filter text field you can enter the search term or value you want to filter on.
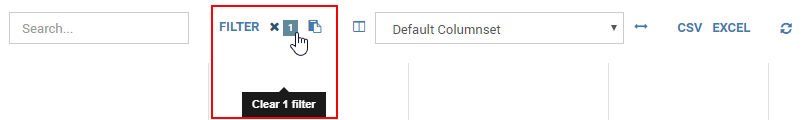
To clear a set filter use the "stop sign" icon next to the funnel icon.

...
click on the number icon that appears on the top when filters are active:
| Note | ||
|---|---|---|
| ||
Keep in mind that if you switch between column sets after filtering the filtering is maintained |
...
! |
Filter by Insights:
When opening the Filter options clicking on the "FILTER" button an additional option becomes available to filter databases by Insight. :
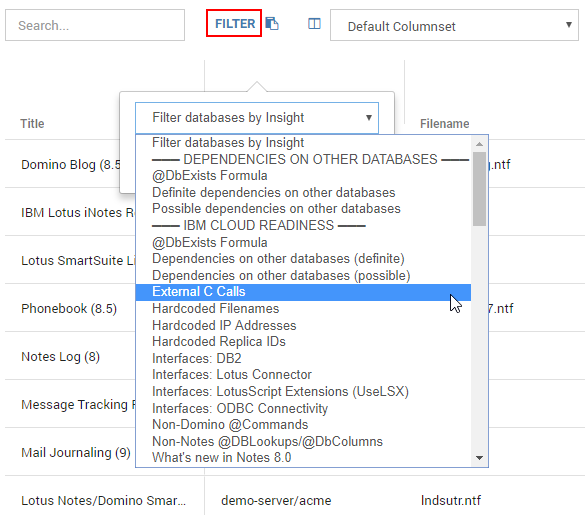
This allows you to make selections based on what type of designs you want to review or to easily export a list of databases containing a certain type of finding.
To clear the filter by insight filter simply click on the little X behind the filter selectionon the number icon that appears on the top when filters are active.
Exporting
...
The two icons next to the Funnel & Clear filter icons allow you to Data
To export the filtered data set as either a CSV or EXCEL file . just click on the corresponding button:

All columns for the filtered databases will be exported. 
Opening a database instances details:
To open the details of any instance simply click on the table row for the instance you are interested in.
...
On opening the database instance details, you will be presented with a header that contains general information about this specific instance. Keep in mind that if a database has multiple instance in its replica set each of them will be analyzed separately and classified separately. This is done deliberately to ensure that you get the most accurate information.
A database might for instance have replicas on three servers but all usage might only be taking place on one server. Also, due to replication restrictions or problems, it is possible that the design on databases sharing the same replica id is not the same.
Therefore, the usage, design and ranking information portrayed in the top is all instance based.
...
Database:
Displays general information about the database instance as taken from the database properties, the size of the database instance, the template it inherits from (or is), whether it is listed in the Domino catalog and whether it is included in MultiDB indexing.
Replication:
Indicates whether replication is enabled and which settings have been activated
Access Control List:
Gives information about how many entries there are in the ACL with a specific level of access and which level of access special user entries like "Default" and "Anonymous" have.
...
This tab is only visible if other database instances have been identified that share the same replica id. If there is no tab for instances then no other replicas were found on the analyzed servers. The value between brackets behind the tab name indicates how many other instances share the same replica id.
Each instance will be identified with its own tab showing that instances "Application" details and a button to open the full analysis details for that instance.
Keep in mind that multiple instances with the same replica id can exist on one server.
...
 Note: Organization information is taken by default from the contents of the department field in the person document for each user in the Domino Name & Addressbook. Your administrator can deactivate this or change the collection process to collect from a different source. Please refer to the Setup Guide for details on how to do this.
...
...
LOC stands for Lines of Code | Ø for average | # for number
...
This tab is only visible if a design analysis was performed on the database, if design findings were found and if it is in scope. In all other cases the tab will not be visible
This tab is where panagenda ApplicationInsights helps you identify potential problems and challenges in the code of your database instance design.
Based on a predetermined list of criteria (rulesets) panagenda ApplicationInsights identifies certain occurrences or combinations of occurrences in your code that could require attention in case of optimization, modernization, transformation or migration.
Findings:
Findings are categorized into ruleset categories like:
- Web Design
- Mail Dependencies
- Special Interfaces
- Operating System Dependencies
- Dependencies On Other Databases
- Specific Code Findings
- Additional custom rulesets you define
Each ruleset can be opened (double click) and will list the type of findings in that category and the number of occurrences in the code. Each finding criteria has a weight that help identify the potential risk of the finding. This is indicated by the color of the finding label.
 Findings classified as more high risk/more complex are shown as red while less important findings would be indicated with green.
 Each finding category can be opened to review the individual code snippets and their location.
Each finding lists the design element type, design element name and the action in which the code is located. It also lists in how many other applications that code element can be found.
Not only does panagenda AI give you the indication of what code elements could be problematic, it also tells you in how many other applications the same code is being used. Allowing you to plan more efficiently and replace code across your platform as you go.
To view the affected code simply click on the element block. The code will appear in the right hand window.
 The affected code lines are highlighted in yellow and their location is visible in the right scroll bar for easy navigation. Use the "<< previous" and "next >>" buttons in the top of the code window to easily navigate tot the affected code lines.
Use the "Open in Designer" button in the right upper corner to open the specific design element in the Notes Designer client directly. This does require that the Notes Designer client is installed and that you have access as a Designer to the specific database. For the "notesdesigner://" links that this button uses to work you will also need to install the panagenda Application Designer Helper as well. To download and install this please refer to: {*}https://www.panagenda.com/2017/10/open-in-designer/* Column Controls
Clicking on the icon left to the Default Columnset selection field allows you to customize the displayed columns:
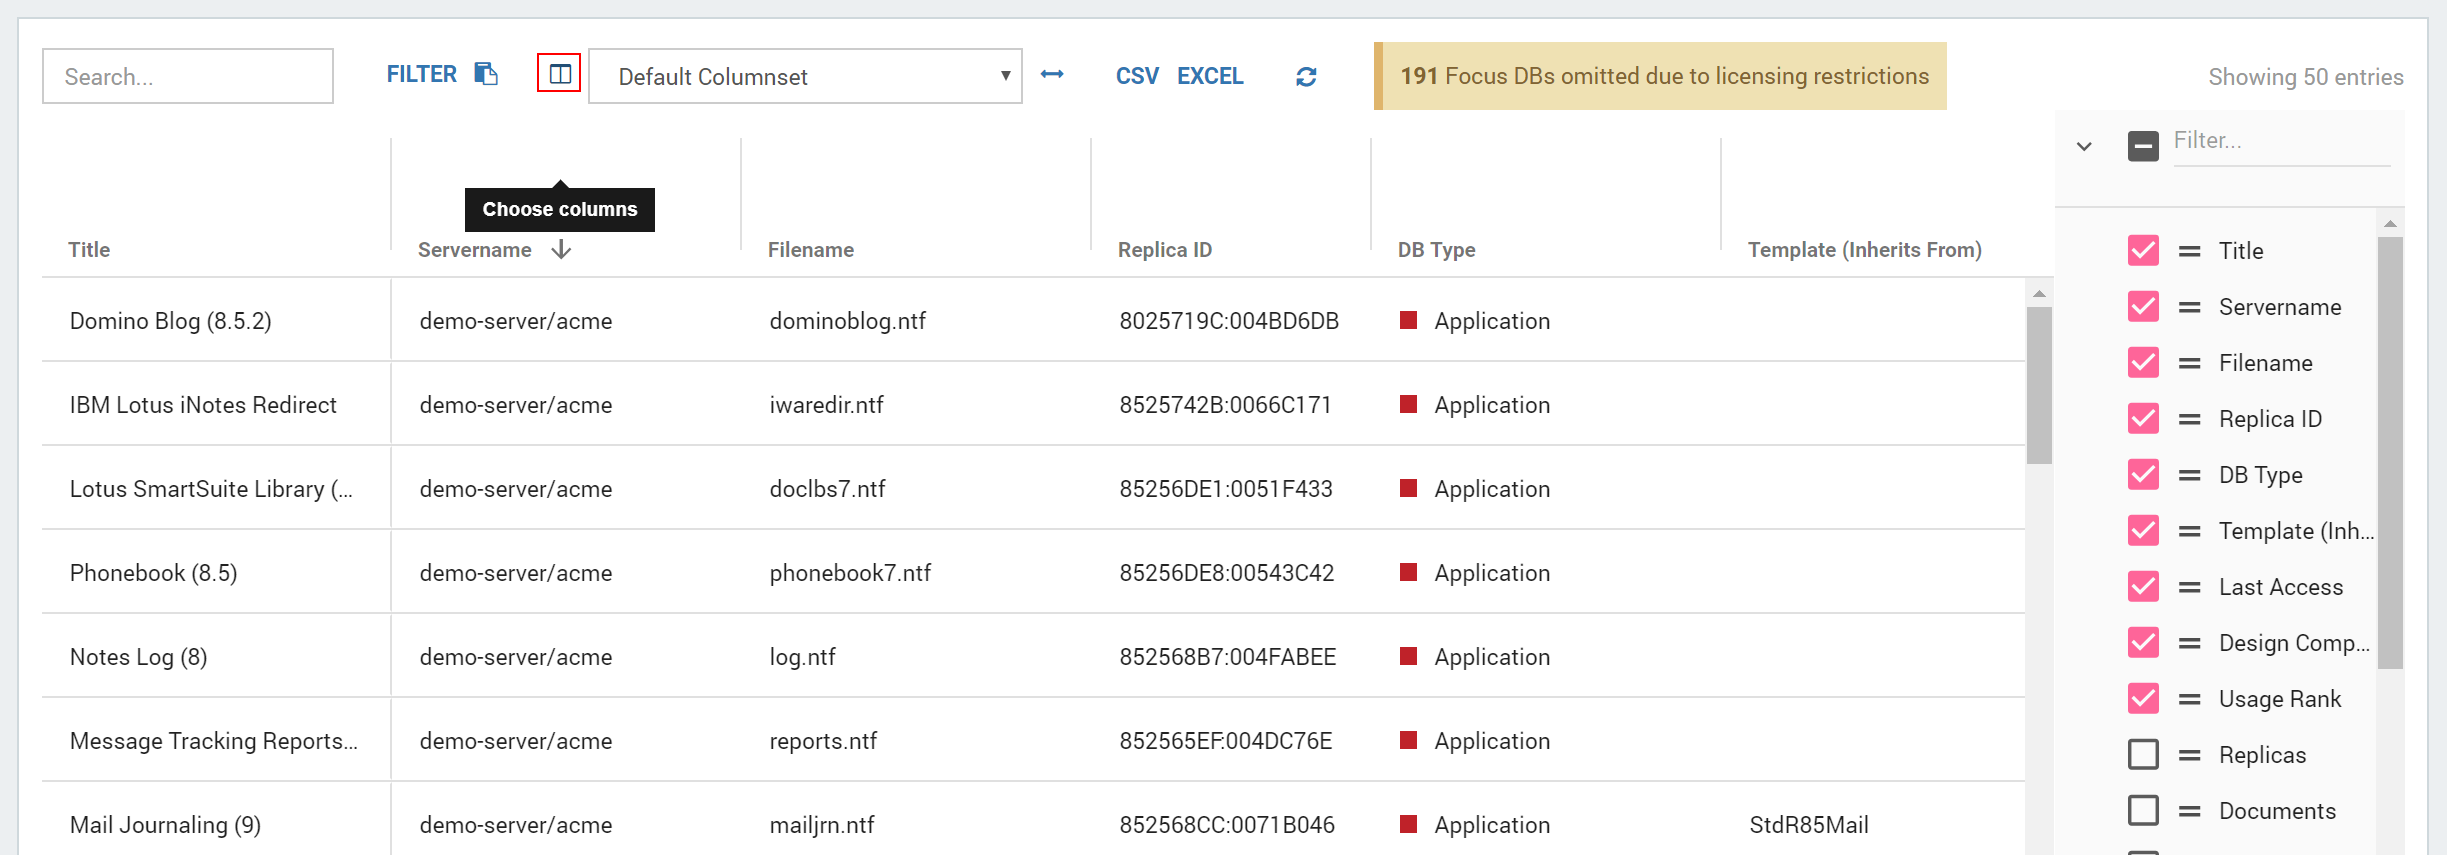
The Catalog views also provide several predefined Default Columnsets which can be selected in the corresponding field.
To fit the columns to the respective character length, click on the arrow button to the right of the selection field.
Databases
The Database view of the Catalog lists all instances your license entitles you to access for analysis. Use the options described under Working with the Catalog above to get the deep dive information you need.
Database Instance Details
To open the details of any instance simply click on the table row for the instance you are interested in. Please refer to Instance Details for more information about this component.
Servers
In this view details to all analyzed servers are displayed. Use the options described under Working with the Catalog above to get the deep dive information you need.
Next Topic: