Page History
2026:
Week 15
Type | Description |
New | New navigation.
|
New | Teams Versions Overview: TrueDEM now has a report showing all Teams Client versions used in calls across all monitored and unmonitored devices in the tenant. It categorizes them by Operating system and version and indicates how many versions of the Windows client are older than 90 days. Under Microsoft-controlled rollout schedules versions exceeding 90 days are classified as outdated. |
New | Applications used in Calls: This report shows all bots & applications that were seen in calls during the last 30 days. It provides insight into the non-human attendees, both native Microsoft, self-build and third party and allows for monitoring for occurrences per month and per day. |
Improvement | Microsoft Service Health:
|
Improvement | User Search page:
|
New | User Experience - Device Insights:
|
New / Improvement | User Experience - Device Summary:
|
Improvement | User Experience - User Experience: Logos for several apps were updated |
Improvement | User Experience: User Summary: Re-designed User Summary page |
Improvement | Teams Connectivity Journey: Added column in table for Teams destination |
New | Call Quality Debug: A new insight was added that alerts when multiple SSIDs Detected during the call for a single user. For more info see Call Insights documentation |
Fix | User Experience - Teams Call List: The "Impacted" rating for Calls no longer includes lowVideoProcessingCapabilityRatio as Microsoft is currently providing incorrect values via CQD. |
Improvement | Grid plugin: Capability to filter one grid via drill-down interactions performed on another grid within the same dashboard |
Fix | Routing Map: The Routing Map has been replaced by the Connectivity Jouney tab on User Experience. The obsolete Routing Map has therefor been removed. |
Fix | Environment Health and App Status: Outdated logos for several apps were updated |
Fix | Improved: Platform Grafana updated to v12
|
Week 4
Type | Description |
Improvement | Managed Network Details:
|
Improvement | Managed Networks with Network related Call Issues: The timeframe for the underlying report when clicking through to an individual network, will now be automatically set to the timeframe selected on the Managed Networks with Network related Call Issues report. |
Improvement | Substandard Wi-Fi Networks for Teams Calls: The timeframe is now automatically inherited from the main report on drill down |
Improvement | User Experience:
|
Improvement | User Search:
|
New | Agent Status: Previously, only build numbers were shown. After requests from our customers we now also show the more recognizable Version names for the OS versions on both Windows & macOS. |
Fix | User Experience
|
2025:
Week 42
Type | Description |
Improved | Single Call Insights page: Added a text box that shows the explanation details for the detected Insights |
New | Real Time Call Data - Details page: Added additional header information
|
New | Real Time Call Data - Details page: Added call insights & platform information
|
New | Real Time Call Data - Details page: Added a separate indicator for Teams app CPU consumption in the CPU graph. |
Improvement | Real Time Call Data - Details page: For graphs where a threshold is available, it is shown as a dotted red line. Updated graphs include those depicting Jitter, Jitter buffer, RTT and loss rates for Audio and Video. |
Improvement | Real Time Call Data - Details page: Improved Raw Call data table by adding newly collected call data and making it more user friendly. Utilizing graphing techniques to indicate Boolean options as icons and percentage values with bars. |
Improvement | User Experience page: Device selection updates Device selection bubbles now also include all devices used by a user as identified in CQD data, not just monitored devices. Devices that can be identified by a device name (e.g. Windows & Mac) will show as named. If the user also made calls on iOS, Android or through a web client, single buttons per platform will be added. Note! This means that if a user used more than one iOS or Android device, there will still only be one iOS or Android bubble. Selection of a device (or platform) bubble will have the following effects:
|
Improvement | User Experience page: The tab User Insights was renamed to Device Insights as it shows device specific information based on the selected device bubble. |
Improvement | User Experience page: Teams Call List updates The following changes were made to the Teams Call List:
|
New | New report under: Microsoft Teams -> Teams Network Reports -> Managed Networks Call Overview This new report provides insight into how your managed networks are doing and which managed networks are showing network related issues with Teams calls. This report will allow you to quickly identify problematic managed networks and help with remediating problems that could have significant impact on your users. Using the option to drill down, will give you access to further details specific to the selected network as well as an overview of the users on that network. For more information on the overview page see: https://www.panagenda.com/kbase/x/PYUeBw and for Managed Network Details: https://www.panagenda.com/kbase/x/RYUeBw |
Improvement | Removed preview status of the Teams Relay Region Analysis & Teams Media Analysis |
Improvement | User Search: Removed the Streaming metrics link from the Search results. Live call data can be accessed through the User Experience - Teams Call List page |
Fix | TrueDEM® Agent Status: The sort order for the Agent Version graph was adjusted to sort newest to oldest again |
Improvement | Various navigation changes: Adjusted the following navigation tiles under the Microsoft Teams tile: Cleaned up the bread crumb navigation on the homepage |
Fix | Corporate Network Call Quality: Call Quality by Corp Network Grid - Changed the calculation from distinct calls to distinct user calls |
Fix | Outage Report: The table is now sorted descending by End date. Previously this was by start date |
Fix | Resolved an issue in the M365 Core Scan for Delve where results were not consistently displayed. |
Improvement | Microsoft M365 Application Status: The UI was optimized in preparation of new monitored workloads. |
New | Environment page: New workloads were added to the M365 Environment workload scanning. Making it possible to see the actual status of service quality for your users. New workloads:
|
Week 31
Type | Description |
Improvement | Grafana Portal Update: Grafana v11.4 |
New | User Experience page: If a user has recently used multiple devices, it is now possible to switch between these devices without having to go back to the User Search. Bubbles in the top identify the Windows & MacOS devices that were recognized as being used by the user. To switch to a different device, simply click on the bubble. Do keep in mind that available data might differ between devices based on Opperating System and the availability of a TrueDEM agent on that device. The "Teams Call list" will display all calls regardless of which device is selected. |
New | User Experience page: If a user is in a call, this will be made visible on the User Experience page by an icon on the device bubble (if there are more than one devices listed for the user), as well as the tab for Teams Calls. This helps identify if the user is in a call and on which device. |
New | User Experience page: The user's manager is now listed on the User Summary tab and allows for a direct drill down into the managers User Experience page. |
New | User Search: An icon now identifies the device OS (Windows/MacOS) on search results. |
New | Agent Status page: MacOs and Windows devices are now indicated separately in the active Agents graph. |
Improvement | Agent Status page: It's now possible to filter for Windows or MAcOs devices in the Agent Version & OS Version graphs |
Improvement | Real time Call Data - Details page: The mouse over annotation text for change events now includes both the information of the state before and after the change. Example "Audio Recv. Codec changed from: SATIN to SATINFullBand" |
Fix | ISP Overview Page: The column for "% Diff" contained incorrect and misleading data, this was corrected. The filter at the top works now also against the % Diff column |
Fix | Call Quality Debug Level - Single Call Insights page: Fixed an issue with the KPI's in the top that caused a wrong calculation of totals. Same issue also caused unnecessary scroll bars to appear in certain situations. |
Fix | Active Calls on Selected Network page: Resolved issue that could cause a data mismatch between Active Calls on Selected Network and live call status page |
Fix | User Experience: Call List: fixed an uncommon issue where average figures were displayed incorrectly |
Fix | Call Debug page: Fixed an issue that could cause an empty Real Time data page to appear when a user clicked on the Realtime Link for an Ongoing call |
Fix | Call Debug page: Fixed issue where sometimes the Realtime Link appeared although the user was not using a TrueDEM monitored device |
Fix | Corp. Network Call Quality page: In the Media Relay Location by Corporate Network grid the "Pct. Poor Calls" column header was renamed to prevent confusion |
...
Type | Description |
Improvement | User Experience - Teams Call List: participants of Townhall meetings and Live events with the TrueDEM agent installed will now also show these in their call list. Microsoft only provides call telemetry data on Townhall and Live Events for presenters, organizers and producers, not for participants. With TrueDEM we provide insights for all participants as well. |
| Fix | Events Timeline on User Experience: There was a minor issue where the network was not displayed on the events timeline |
2024
Week 51
Type | Description |
New | Teams Media Analysis: This report provides insights into the Team's media usage of video and screen sharing across departments. |
| Improvement | User Experience - Teams Call List: From now on, all calls for which CQD or Real Time data is available will be shown immediately. In the past, calls were not shown until CQD data had been received from Microsoft so a complete picture could be formed. As Microsoft CQD data is only avaialble after a call has finished and is often delayed, this meant that calls were not avaialble in the call list until approximately 30 minutes after the call. We've now updated the view to show the call in the list as soon as we have Real time data or CQD data. This means calls are visible as calls are ongoing for monitored devices and available for calls on unmonitored devices after Microsoft CQD data is available. |
Improvement | Call Debug Page: Enhancement to show data regardless of the availability of Microsoft call records |
Fix | Substandard Wifi Networks: An issue has been resolved where the sorting of columns, such as the SSID column, did not function as intended. |
Fix | Substandard Wifi Networks: An issue has been fixed where cells with a zero value appeared empty. |
Improvement | Corporate Network Call Quality: The header is compressed to remove unnecessary white space |
Fix | Direct Routing - Caller Country Details: Resolved an issue where a general error appeared on world map visuals when no data was available. |
...
Type | Description |
| New | On the User Experience page a new tab was added called "Connectivity Journey". Through this tab you can see the exact connectivity journey (hops) a user took to connect to the Microsoft Teams cloud during the day. By clicking on a scan line, you get the details consisting of information about the users local IP, local Wifi/network connection, their ISP (first & last) and connection to Microsoft Teams as well as a list of all the hops in between. |
| Improvement | On User Details: The "Teams Version History and CPU Utilization" table will now also mention the Teams v2 version numbers |
| Improvement | On User Details: ISPs Identified for this user panel has now a the option to click through to Final ISP details |
| Improvement | The "Preview" indicator on tiles were moved to prevent accidentally clicking on them instead of the tile |
| Improvement | User Experience is no longer in Preview status |
| Improvement | On User Experience, the data is no longer limited to 7 days but now shows up to 21 days of data and is configurable through the date/time picker |
2023
Week 50
Type | Description |
| New | New Call List: The Call list has been improved by combining insights and data about the call, the call quality for the user as well as the call quality for the other participants. Making it a robust and strong insight into what the call quality is for any user in your organization! To see further details about a call quality for the participant or other participants, simply hover over the icons that indicate problems or click on the call to get to the call details. |
| New | If the user is in a call, a purple button will appear at the top of the call list on the User Experience page and allow you to switch immediately to the Real Time Call data - Details for that user & call as it is going on. This means that you now can see full call details even if the call is still ongoing. Note! There is a processing delay of 3-5 minutes before the data is visible. The streaming metrics page is still available if you want to see the near real time values but keep in mind that the Real Time Call Data - Details page has a lot more data to show |
| Improvement | New format of the Real Time Call data - Details page:This page has been changed and improved to highlight potential problems during the call. Changes:
Between these two graphs, you will be able to see the type of issues occuring for the user and whether it was momentary or consecutively having an impact. |
| Improvement | In order to make the navigation more logical, the call list was moved into the User Experience page and combined with the call metrics already there. |
| Bug fix | The call metrics page was streamlined and certain obsolete graphs were removed. |
| Improvement | On the Call Live Details there is now a link available to the Streaming metrics page to quickly move between them |
| Improvement | The Changes indicators on the Real Time Call data - Details page were moved to the top to make it more clear what happened during the call |
| Improvement | The "Open list" link that will take you to see the calls was changed to point at the new call list on the User Experience page. In future this link will be removed |
| Improvement | The User Experience page now gives you a time/date selector to indicate the period for which you want to see calls and call metrics. The default is 7 days but this can be increased up to 21 days or any specific range within that period. |
| Improvement | On the Real time Call Data - Details page in the Video section: Reorder Video Packets is no longer a cumulative curve |
| Improvement | On the Real Time Call Data - Details page in the Screen sharing section: Reorder screen sharing packets is no longer a cumulative curve |
| New | On the Real time Call Data - Details page in the Screen sharing section: Two new charts:
|
| Bug fix | On the User Details page: Removed Media Relay list & geo map due to Microsoft changing the information |
| Improvement | On the User Details page: Moved down the Teams version table to below the call list |
| Bug fix | On the User Details page: Bug fix on the connectivity journey (user details) where a connection of 100mb was shown instead of 1gb. |
...
Type | Description |
Preview | User Experience page received two new tabs Teams Call information & Device Information |
Improvement | The top section for the User Experience tab has been rearranged to show information about the user and location as the device information is now depicted on a separate tab. |
Improvement | Anew color scheme and other navigation enhancements have been implemented to make navigation more visible |
Improvement | Datetime format and locale now match with the Grafana setting |
Preview | A new report was added to show Outage information with the option to export a list of affected users. |
Preview | A new report was added under the MS Teams section to open a report showing information about the OS & Teams versions running on devices equipped with our agent. The report can be used to get insights into version distribution and allows for pivoting the data. |
Fix | Device Hardware Report: The column DeviceType had a trim function that would only allow the first 19 characters to be visible. This has been altered to show up to 128 characters. |
New | Environment status: The ISP list is now clickable. When clicked they will show the performance of the various workloads for the specific ISP. Note! Only the 6 ISP's with the most users at that moment are shown. In small organizations these subset numbers might be skewed if less than 100 users use the ISP. |
Improvement | Call List: Two columns were added showing the overall call quality for the call and a list of icons for the users. On mouse over the names can be seen and the column can also be used to filter for specific users. |
Improvement | Call List: The Duration column was aligned right for better understanding |
Preview | Call Quality Debug Level: A new section was added with two preview features: 1. A Sankey diagram depicting the relevant duration of particular problems like audio, video or other issues occurring for users in either the upload or download streams. 2. A table containing users with problems and the metrics that should be looked at for those users |
Improvement | Real Time Call Data - Details: We added a RAM usage graph and redesigned the CPU graph to a heatmap showing the top processes as well as a "Possible OS drivers" and "Other Processes" category. The 'crosshair' feature that allows you to mouse over one graph and will show an indication line now also works with the CPU and RAM graphs |
New | Real Time Call Data - Details: Changes like a change in WiFi network, codec or audio/video device used during calls are now highlighted. Both as text indicators at the top of each section as well as indicators in each graph. Move over with your mouse to see the change. |
Preview | A new Microsoft Teams Rooms view has been added to the navigation for easy identification and reporting on MTR's (Note! This feature requires separate licensing and will appear 'locked' if not licensed |
Week 18
Type | Description |
|---|---|
| Fix | Fixed a problem with the Tenant Wide Overview page |
| Improvement | column sorting/filtering enabled on all ISP pages |
Week 14
Type | Description |
|---|---|
Type | Description |
| Fix | The new Real Time call page now can now also be opened from the user search page and fully replaces the previous page |
| Improvement | User Details: Call List table now uses Real Time data for CPU & Memory usage |
| Improvement | User Details: Through the button in the top right you now have direct links to detailed user reports which will open directly for the right user & device |
| Improvement | User Details: Windows update history table was removed. Individual updates to windows components will be listed in the Added software table instead |
| Improvement | Agent Support page is renamed to TrueDEM Agent Status |
| Fix | Teams Version History & CPU graph fixed by using real time data |
| Improvement | Several old dashboards were moved to the Legacy folder and will in time be removed. These are obsolete or will be replaced soon |
| Improvement | New Monitored services were added to the Environment Health status page. These include:
Click on any of the services to see the status of monitored elements. |
| Improvement | The Application processes - Real Time Call Data - Details shows the top 5 CPU using processes. All other processes are now summarized into "Other User Processes" and "Possible OS & Drivers". |
Week 11
Type | Description |
|---|---|
| Fix | Fix on Call Quality Debug Level page to avoid Errors on the User Details page. The open User Details drill down link will now only appear if a pguid is available meaning that it will only show a link to the user details if the users device contains an EPM agent. |
| Improvement | User Details page: Added new table to Software Related Metrics Section with Information of which Software got added/removed |
| Improvement | User Details page: Realtime Monitoring Link (right top corner) will open liveV2 |
| Improvement | User Details page: The Call list now shows a new date/time column, representing the time a user joined the meeting. The exisiting meeting start time column was moved to the end of the table but is still available. |
| Improvement | The default homepage will from now on open the AppPlugin whenever you login to TrueDEM Portal or click the Grafana logo in the left bar |
Week 4
Type | Description |
|---|---|
| Improvement | Grafana was updated to version 9.3.1 |
| Fix | Fix applied to home page to fix missing data element |
| Fix | Fix applied to Call Quality Debug page to fix problem with links that do not show for people in certain situations |
| Improvement | New pages were added to show Environment Status and Microsoft Health for your environment |
2022
Week 51
Type | Description |
|---|---|
| Fix | Performance improvements to the Call Quality Debug page |
| Improvement | Restructured the collection of data to minimize impact on the agent/user |
Week 49
Type | Description |
|---|---|
| Improvement | On user details the existing graphs for CPU usage Over Time and Memory Usage Over Time now are filled by data coming from the Streaming Metrics data. This means that we now have data points at a much shorter interval. You can even zoom in to see more details. |
| Improvement | We added two new graphs on the User Details page in the Users' Network section to show Network traffic - Sent kbits /Sec & Network Traffic - Received kbits/Sec. These are also based on streaming metrics data. |
| Improvement | we added a table in the Teams Call Expanded Details section on the user details page to show 'Teams Voice Endpoint Latency' that shows you which endpoints are performing best or worst. |
Week 40
Type | Description |
|---|---|
| Fix | Fixed issue with data not showing in Direct Routing optimization |
| Preview | Version 2 of the new Real Time metrics page is released. The page can be accessed by changing the URL of the existing real time metrics page to include V2: ( .../live/... to .../liveV2/...) |
Week 37
Type | Description |
|---|---|
| Improvement | User Details page: Fixed problem with hover over on bar charts not showing a legend. |
| Improvement | User Details page: Adjusted the process tables to show only significant processes. A significant process is any process that was in the top 10 of processes consuming CPU at the scan interval plus any of a predefined list of processes we will always monitor (Teams, Chrome, etc). |
| Fix | Remove empty lines in Hardware report |
| Improvement | Routing map: We enhanced and added maps for all three tested workloads (Teams, Presence, Outlook). This changes the layout for the page but also now gives you the option to see the different routes your data is taking for different workloads |
| Improvement | On the Corporate Network Call Quality Report (Reports folder) Microsoft was removed as an ISP as it was confusing and could lead to inaccurate conclusions. |
Week 36
Type | Description |
|---|---|
| Fix | Fixed several errors that could cause red errors in certain dashboards |
| Improvement | User Details page: We moved the OneDrive info into a separate section at the bottom of the page and changed the graphs. |
| Fix | Fixed a problem on the call list where sometimes calls were shown more than once. |
Week 34
Type | Description |
|---|---|
| Fix | The User Search page only requires search strings of 3 or more characters |
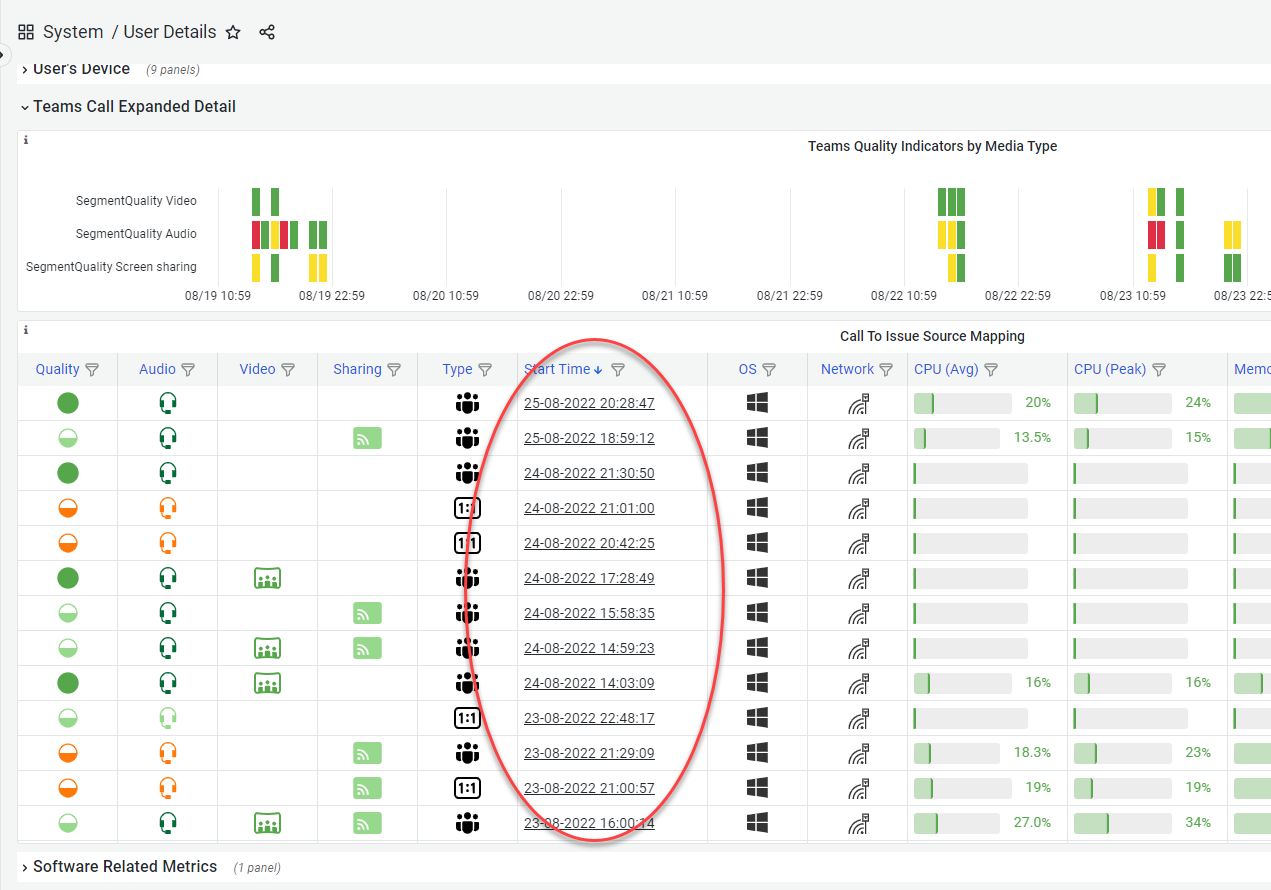
| Improvement | User Details page: In the section "Teams Calls Expanded Details", the calls in the list are now clickable and will take you to the call details page for that call.
|
| Fix | Interface improvements for consistency |
Week 33
Type | Description |
|---|---|
| Improvement | Removed obsolete graph panels on the Microsoft Services dashboard |
| Improvement | The New portal homepage is now dynamic. Meaning that we can release new pages to customers more quickly (this will happen soon!) |
| Improvement | User Details page: The values for Last Reboot Time and Device Model were added tot the page header. |
Week 30
Type | Description |
|---|---|
| Improvement | On the Agent Support page, the bar charts are now clickable & exportable |
| Improvement | Real Time metrics page:
|
| Fix/Improvement | in the Exports of lists from the new App:
|
| Improvement | Agent History Report:
|
| Improvement | Real Time metrics page:
|
| Improvements | Tabs in the portal app now show the name of the page |
| Improvements | Logo on all app pages is clickable and takes you back to home page |
| Improvements | We removed some icons from links and show only an icon if we open that link outside the current tab ('jump out') |
| Improvement | Improved ISP Overview page renders the ISP Overview by ASN page obsolete. The obsolete page was archived |
Week 28
Type | Description |
|---|---|
| Improvement | The Real Time Metrics page showing metrics during calls now shows pre-loaded historical data from earlier in the call |
| Fix | The number of "failures to connect" and "mid-call drops" on the Tenantwide Overview page was corrected as it showed incorrect values in certain cases. |
...