2025:
Week 18
Type | Description |
Fix | User Details - Connected Network and VPN Adapter Panel: A fix was applied to prevent situations in which where details were not always shown. |
New | Call Quality Debug Level page: TrueDEM now introducing Insights on single Call level. Insight are aggregated indicators of potential issues for administrators to look into. They offer a highlevel overview on the Call debug page of areas to look into with possibility to drill down to Call Insights page for more details. For more information on the Insights see: Call Insights |
New | Call Quality Debug Level page: The Attendees Timelines section was expanded to hold an overview of the platforms used during the call as well as any platform switches made by users during the call. This gives you insight into what the user was using during that call and what changes on platform level took place. |
Improvement | Call Quality Debug Level page: The Attendees Performance Timelines table now includes time & device details so to differentiate between devices for users who switch platform/device during the call. |
Improvement | Call Quality Debug Level page: The TrueDEM Agent Enhanced Network Detail table in the Local Networking section was updated to include only the timeframes where the TrueDEM Agent reported data. |
New | TrueDEM Agent Status: A new report was added to this page called "License distribution for Active Users" to show the TrueDEM License distribution for Active Users. This page allows insight into how licenses the organization utilized per month and allows for exporting an overview of licenses used in the previous month for verification purposes. |
Improvement | Teams Media Relay Analysis: The MediaRelay list was updated (backend) to improve reporting. |
Fix | Corporate Network Call Quality Page: In large environments the affected managed networks sometimes failed to load. This has been addressed and fixed. |
Improvement | Teams Version Report: Improved the way how to detect the Teams Version and two obsolete columns were removed. The report's timeframe was consolidated on 21 days. |
Improvement | Teams Version Impact Analysis Report: Updated the way in which the analysis is performed for optimalization purposes. |
Improvement | User Details - Teams Version History and CPU Utilization: Updated the way how we perform the analysis for optimalization purposes. |
New | User Experience - User Summary: Added Assigned Microsoft Licenses to tab to give adminstrators a full overview of the M365 licenses the user holds. |
Fix | Microsoft Outage Analysis: Fixed an issue where the Excel download was not always working after the previous update of the underlying Grafana platform. |
Week 12
Type | Description |
Fix | Teams Media Analysis Page: Fixed a problem in the "Teams Media Usage Summary by Department" table where a percentage calculation didn't portray accurate numbers if the total was over 100% |
Fix | Fixed issue with Call Quality Debug Level page failed when several hundred attendees are in a call |
Improvement / New | On the Call Quality Debug Level page we improved the "Local Network Connection based on Microsoft Call Records" table in the Local Network section, and added an additional table to show TrueDEM Agent Enhanced Network Detail. This allows you to compare aggregated Microsoft data and real-time TrueDEM agent data for all attendees in the call in one place. |
New | On the Call Quality Debug Level page we added an additional section called "Attendee Timelines" that depicts a single overview of real time TrueDEM agent data for comparison for all attendees with a TrueDEM agent |
Improvement | Improvement: Various visual improvements were made to the underlying AG Grid technology that is used to render tables. |
Improvement | Obsolete Matomo elements were removed |
Improvement | The underlying Grafana environment was upgraded to the most recent stable version. Minor changes can be expected to the look & feel of Grafana and several technical improvements that will enhance the user experience. |
Improvement | Viva Engage Workload naming has been updated in various locations |
Week 7
Type | Description |
New | Microsoft Teams > Teams Relay Region Analysis Report: This report shows you which relay regions are utilized during calls by your users and the latency they are expected to experience while doing so. This report allows you to see if there are any proxy, VPN or other network routing related issues that could influence your users user experience during calls. For more information, please consult: Teams Relay Region Analysis |
New | Admin Reports > Microsoft Outlook Versions Report: This report gives you insight into the distribution of Outlook client versions your users have installed. Detect any users still clinging to the Classic client as well as identify users who’s automatic update process has perhaps halted. For more information please consult: MS Outlook Versions Report |
Improvement | The menu under “Microsoft Teams” has been updated to accommodate a tile for the new Teams Media Relay Regions report. Two existing reports pertaining to Direct Routing and Enterprise Voice cost optimization have been moved into a menu accessible under a new tile called: “Enterprise Voice” |
Improvement | Call Quality Debug Level Page:
Note! The codec is both retrieved from Microsoft as well as form the TrueDEM agent but if available will be used from the TrueDEM agent as this one is more granular and specific than what Microsoft call records return. |
Improvement | A new table grid layout already used on tables in some report pages provides advantages in regards to column sorting and filtering as well as offering options for column selection and pivot tables. The following report pages have been updated to now use this new grid layout for tables as well. We will continue updating pages and tables with this new layout as we go.
Note: This change does not affect data, just the representation of the data. |
Improvement | The Teams Media Analysis page was reworked and now has an improved interface. It also now contains additional graphs showing the times video and screensharing where used in calls on the organization level. The Org-wide table in the top now categorizes by Operation System and Type of Call as well for easy classification. |
Fix | An adjustment was made to the Delve scan. This was needed because of the recent retirement of certain Delve features. |
Week 2
Type | Description |
Improvement | User Experience - Teams Call List: participants of Townhall meetings and Live events with the TrueDEM agent installed will now also show these in their call list. Microsoft only provides call telemetry data on Townhall and Live Events for presenters, organizers and producers, not for participants. With TrueDEM we provide insights for all participants as well. |
| Fix | Events Timeline on User Experience: There was a minor issue where the network was not displayed on the events timeline |
2024
Week 51
Type | Description |
New | Teams Media Analysis: This report provides insights into the Team's media usage of video and screen sharing across departments. |
| Improvement | User Experience - Teams Call List: From now on, all calls for which CQD or Real Time data is available will be shown immediately. In the past, calls were not shown until CQD data had been received from Microsoft so a complete picture could be formed. As Microsoft CQD data is only avaialble after a call has finished and is often delayed, this meant that calls were not avaialble in the call list until approximately 30 minutes after the call. We've now updated the view to show the call in the list as soon as we have Real time data or CQD data. This means calls are visible as calls are ongoing for monitored devices and available for calls on unmonitored devices after Microsoft CQD data is available. |
Improvement | Call Debug Page: Enhancement to show data regardless of the availability of Microsoft call records |
Fix | Substandard Wifi Networks: An issue has been resolved where the sorting of columns, such as the SSID column, did not function as intended. |
Fix | Substandard Wifi Networks: An issue has been fixed where cells with a zero value appeared empty. |
Improvement | Corporate Network Call Quality: The header is compressed to remove unnecessary white space |
Fix | Direct Routing - Caller Country Details: Resolved an issue where a general error appeared on world map visuals when no data was available. |
Week 47
Type | Description |
New | WiFi Network Analysis report: A new report, that will give you insight into the readiness and performance of WiFi networks used for making Teams Calls, was added to the Teams Reports section. It provides insights into WiFi networks (both office & remote networks) that are potentially substandard for doing Teams calls on. It allows you to proactively identify these networks and the users who rely on them so you can take remediation actions or inform users. For more information please see Substandard WiFi Networks for Teams Calls. |
| Fix | User Search: For users utilizing the TrueDEM M365 license only, the link to the User Details page will be locked as it is not relevant with the TrueDEM M365 license only. |
Improvement | User Experience page - Connectivity Journey: Enhanced accuracy when people are on VPN |
Fix | Teams Reports - EV Utilization & Cost Optimization page: Resolved an issue that caused an error when opening this page |
Week 44
Type | Description |
Fix | ISP Overview: An issue was corrected with the Average RTT in all Countries calculation. |
Fix | Corrected an issue that could cause the Overall Trend of Tenant RTT to have a memory failure |
Week 43
Type | Description |
New | User Experience page - User Insights - Timeline: We've added the used network adapter in the Description field |
Improvement | User Experience page - User Insights - Timeline: Removed obsolete lines and updated the tooltips |
Fix | User Experience page - User Insights - Timeline: Corrected an issue where users using an VPN while on an unmanaged network were unintentionally marked as using a managed network |
Improvement | User Experience page - User Insights - Timeline: Corrected the tooltip for the base line for Device metrics to only show scores. Sublines for CPU and Memory also got updated to show the calculated score, the minimal value meassured in the timeframe and the 90th percentile value of meassurements. This to ensure outliers won't color the result too much. |
Improvement | User Experience page - User Insights - Timeline: Teams Calls represented on the timeline now follow the join/leave time of the user, not the start/end time of the call. |
New | User Experience page - User Insights - Timeline: For Teams calls we now show 3 distinct lines:
The worst quality experience from either the User summary or Real-time Details is rolled up to the summary line which also shows when consecutive issues occur (based on real time data). |
Fix | User Details: The obsolete event timeline and Connectivity Journey graphs were removed from the User Details page as these have been fully replaced by the enhanced Event Timeline (first tab) and Connectivity Journey (second tab) on the User Experience page. |
Retired | The following pages have been retired:
|
Week 40
Type | Description |
Fix | User Experience page: Inconsistency in "locked" messages resolved if the user has a M365 core license only |
Improvement | User Experience page: Help Text |
Fix | User Experience page: Navigation fixed where it wouldn't work correctly with the browser back button |
Fix | User Experience Page: License Issued date corrected where it showed the wrong issue date |
Fix | TrueDEM Agent Status: TrueDEM Manager versions didn't always match with the number of Agent Versions (note! There are situations in which this can be correct, in general though the numbers should be the same) |
Fix | User Experience page - Call List: Some inconsistency in the KPI figures (total calls,etc..) could arise in certain situations. This has been resolved now |
Fix | Teams Version Impact Analysis Page reflects new Teams versions |
Fix | Real Time Call Data - Details page: The number of Internal vs total (internal & external) participants in the call were switched |
Week 36
Type | Description |
Fix | The MTR report button on the Home page will be fully hidden (previously visible but locked) if the organization does not have a MTR license |
Improvement | The App Status page is no longer in preview mode and is now fully part of the product (removed preview indicator) |
Improvement | On the User Search page, we now show the type of license that was assigned for the user (assigned license determines what monitoring information is collected and displayed) |
Fix | The option to filter by Focus Group on the User Search page has been removed |
Fix | On the TrueDEM Agent Status an indicator was added to show the page is loading |
New | A new report was added to the TrueDEM Agent Status page under the deployment section called " Track deployment by Machine". This report allows you to search for a monitored device by name to see the deployment status of the TrueDEM agent and the history of updates. The overview allows for pivot table analyses |
Fix | Removed obsolete "Agent Version Upgrade" report link (replace by new Track Deployent by Machine) report |
Improvement | Links from the TrueDEM Agent Status page now open the User Experience page instead of User Details |
Improvement | The user's license tier and assignment date of that license are now visible on the User Experience page |
New | User details previously listed at the top are now shown on the User Details tab and also visible by clicking on the (i) icon behind the users name in the header. The button to go to the User Details page was moved to the user Details tab. |
Improvement | On the Connectivity Journey tab of the User Experience, the warning text associated with the alert icon has been changed to "Certain Segments/Portions of the scan cannot be verified". Previous text suggested that the whole scan was incomplete, this is not the case, only parts of the journey cannot be verified. |
Fix | On the Connectivity Journey tab of the User Experience the user can choose between Teams and Outlook to see the scan list for. Before only Teams scans were shown. |
New | Previously, the Connectivity Journey tab on the User Experience page allowed you to see scans up to three weeks old. You can now see scans up to 90 days old |
Fix | If opening the User Experience page results in an error, an error message will be shown to indicate it. Previously it would keep showing a 'Loading' message. |
Improvement | The navigation on the User Experience page (breadcrumb) will remain visibe at the top of the page (sticky) even when the user scrolls down. |
Improvement | Tables shown on the User Experience will use all available screen space. |
New | Real Time Call Data - Details page: The following new information has been added to the header section: Teams version |
New | Real Time Call Data - Details page: The following new information has been added to the Network section: 1. "Inbound/Outbound Network Util %" 2. "Wifi Network and Access Point used (SSID/BSSID)" -> Shows to which wifi network and access point the user was connected during the call and if changes occurred. |
Improvement | Real Time Call Data - Details page: Under the Application section section the "Total CPU in %" graph now also includes an indicator for the priviliged CPU utilization as well |
New | Real Time Call Data - Details page: The following new information has been added to the Audio Details Section: 1. "Audio Devices used" > Shows you which (third party) microphone & speakers were used during which part of the call |
New | Real Time Call Data - Details page: The following new information has been added to the Video Details section: 1. "Video device used" -> Shows you which (third party) video device was used during which part of the call 2. "Video Send Bitrate" 3. "Video Receive Bitrate" 4. "Video Receive Loss Rates" 5. "Video Encoder Pauses" |
New | Real Time Call Data - Details page: The following new information has been added to the Screensharing Details section: 1. "Does ScreenSharing transmission lags?" 2. "Screensharing Encoder Pauses" |
Improvement | Real Time Call Data - Details page: The Raw Call Data table at the bottom now uses a new table design that allows for better and improved filtering, sorting, searching and exporting. |
Week 22
Type | Description |
| New | The User Insights tab on User Experience has been updated to show an interactive timeline for the most crucial elements of Network, Device and Call insights. Allowing administrators immediate insights into network connectivity, device performance, updates and other factors that can the impact user experience as well as making potential interaction of these with bad calls visible. The Event time line by default shows information for the last 7 days but users can zoom in and out (max 3 weeks) for more or less details as well as change the granularity of indicators from 15 minutes to one hour. |
| New | We've added a Participant Count graph depicting the number of people in a call and how it develops during the call on the 'Real Time Call Data - Details' page. |
| New | Additionally, a list of TrueDEM monitored users was added to the 'Real Time Call Data - Details' page to allow you direct links to the call monitoring details of other users in the call. |
| New | The Connectivity Journey tab on the User Experience page has been updated to include also the partial and potentially inaccurate scans in the list. Before these were not included. Partial or potentially inaccurete scans are those where we do not have full end-to-end details or are unable to resolve results. An icon indication is shown if this is the case. |
| New | The Connectivity Journey now shows DNS Server as well on Device Tile |
| New | Added Information on User Details – Teams Call Expanded Detail and Users Network sections, highlighting that this section and certain visuals will be removed in a future release as they are replaced by the information on the User Experience Teams Call tab. |
| Improvement | We continue to improve and updated the help documentation on various pages & graphs as well as in the knowledge base for TrueDEM® Portal. |
| Improvement | Outage Analysis Page & Closed Incidents page: Minor adjustments of the grid for consistency reasons |
| Improvement | On the User Details page (in the header), we now show the type of Microsoft Teams license the user has. Either Standard or Premium. |
| Improvement | We now also show the OfficeExpert TrueDEM Manager version a user has installed on the User Details page (header). |
| Bug Fix | Outage Analysis Page: Fixed bug to show "No Data to Show" in case no data is available |
Week 7
Type | Description |
| New | Microsoft Health page: A link was added to show you a fully exportable list of all recently closed incidents and advisories. Incidents and advisories shown in this list are those that occurred in the last 30 days and are relevant to the Microsoft tenant. |
| New | User Search page: The user search page now remembers the users you've recently interacted with and shows them as "Recently visited" items by default even before you have to do a search. Items on the recently visited page are personal and can be removed individually ('x' in the last column) or collectively "x Clear history" option in right upper corner. This feature allows you to quickly return to the user's you are currently or often interacting with. |
| New | User Search page: An option was added below the search field to only include search results for users with the OfficeExpert agent installed. This feature allows you to eliminate finding results for whom now TrueDEM data is available because they do not have the agent installed. For example: System accounts, test accounts, etc. This feature is activated by default but can be deactivated to include those results if wanted. |
| New | User Search page: A secondary option was added to only include "Focus Group" users. This feature allows organizations to search specifically for users specified by the organization as belonging to the focus group. More information about this feature can be found here: https://panagenda.com/kbase/display/OE/How+to+use+the+Focus+Group |
| Improvement | User Search page: The requirement to enter at least 3 characters in the search box has been removed |
| Improvement | We've added a link on the User Details page that allows you to switch to the user's User Experience page. |
| New | Real Time Call Data Details page: An indicator was added to the top of the page to indicate if the call represented is an ongoing call or has ended. This is important when the call is opened from the Live Teams call overview and can be ongoing. |
| Improvement | Real Time Call Data Details page: We've streamlined and optimized the top section where general info is shown about the equipment and codec used during the call |
| Improvement | Real Time Call Data Details page: adjusted the coloring for the audio, video & screensharing diagram |
| New | Real Time Call Data - Details page: A new section was added with a table containing the raw call data at the bottom of the Real Time Call Data Details page. To identify the exact changes and also to allow the customer to export the data for further analysis. |
| Improvement | User Search page: The link to "Call list" is only shown from now on if the user has the OfficeExpert TrueDEM agent installed and there is call data to be shown. |
| Improvement | The obsolete column was hidden from The User Search page. |
| Improvement | A column called 'Type' was added to the Microsoft Teams Version report to indicate if the Teams client is the classic Teams or new Teams client |
| Bug fix | The Microsoft Teams Version reports now also includes the Microsoft Teams v2 versions |
| Improvement | TrueDEM Agent Status page: The indicator that shows Active Agents was changed to show the active agents seen in the last 21 instead of last 10 days. |
| New | TrueDEM Agent Status page: A bar chart was added to show the distribution of installed OfficeExpert TrueDEM Agent Manager versions. To see a table of the users having the installed version, click on the bar. This table can also be exported |
| Bug fix | User Search page: Corrected an issue where the information text to indicate that we only showed the first 50 search results did not appear in certain cases. |
| Bug fix | We've made several small textual changes to clarify where we talk about the OfficeExpert TrueDEM agent |
| Preview | Help pages: We've started including context specific help pages on several of the interfaces and will continue expanding them in the coming weeks. |
Week 4
Type | Description |
| Bug fix | Fix timezone issue in Connectivity Journey on User Experience |
| Bug fix | Teams Call List on User Experience shows now "No Rows To Show" if no call exists |
Week 3
Type | Description |
| New | On the User Experience page a new tab was added called "Connectivity Journey". Through this tab you can see the exact connectivity journey (hops) a user took to connect to the Microsoft Teams cloud during the day. By clicking on a scan line, you get the details consisting of information about the users local IP, local Wifi/network connection, their ISP (first & last) and connection to Microsoft Teams as well as a list of all the hops in between. |
| Improvement | On User Details: The "Teams Version History and CPU Utilization" table will now also mention the Teams v2 version numbers |
| Improvement | On User Details: ISPs Identified for this user panel has now a the option to click through to Final ISP details |
| Improvement | The "Preview" indicator on tiles were moved to prevent accidentally clicking on them instead of the tile |
| Improvement | User Experience is no longer in Preview status |
| Improvement | On User Experience, the data is no longer limited to 7 days but now shows up to 21 days of data and is configurable through the date/time picker |
2023
Week 50
Type | Description |
| New | New Call List: The Call list has been improved by combining insights and data about the call, the call quality for the user as well as the call quality for the other participants. Making it a robust and strong insight into what the call quality is for any user in your organization! To see further details about a call quality for the participant or other participants, simply hover over the icons that indicate problems or click on the call to get to the call details. |
| New | If the user is in a call, a purple button will appear at the top of the call list on the User Experience page and allow you to switch immediately to the Real Time Call data - Details for that user & call as it is going on. This means that you now can see full call details even if the call is still ongoing. Note! There is a processing delay of 3-5 minutes before the data is visible. The streaming metrics page is still available if you want to see the near real time values but keep in mind that the Real Time Call Data - Details page has a lot more data to show |
| Improvement | New format of the Real Time Call data - Details page: This page has been changed and improved to highlight potential problems during the call. Changes:
Between these two graphs, you will be able to see the type of issues occuring for the user and whether it was momentary or consecutively having an impact. |
| Improvement | In order to make the navigation more logical, the call list was moved into the User Experience page and combined with the call metrics already there. |
| Bug fix | The call metrics page was streamlined and certain obsolete graphs were removed. |
| Improvement | On the Call Live Details there is now a link available to the Streaming metrics page to quickly move between them |
| Improvement | The Changes indicators on the Real Time Call data - Details page were moved to the top to make it more clear what happened during the call |
| Improvement | The "Open list" link that will take you to see the calls was changed to point at the new call list on the User Experience page. In future this link will be removed |
| Improvement | The User Experience page now gives you a time/date selector to indicate the period for which you want to see calls and call metrics. The default is 7 days but this can be increased up to 21 days or any specific range within that period. |
| Improvement | On the Real time Call Data - Details page in the Video section: Reorder Video Packets is no longer a cumulative curve |
| Improvement | On the Real Time Call Data - Details page in the Screen sharing section: Reorder screen sharing packets is no longer a cumulative curve |
| New | On the Real time Call Data - Details page in the Screen sharing section: Two new charts:
|
| Bug fix | On the User Details page: Removed Media Relay list & geo map due to Microsoft changing the information |
| Improvement | On the User Details page: Moved down the Teams version table to below the call list |
| Bug fix | On the User Details page: Bug fix on the connectivity journey (user details) where a connection of 100mb was shown instead of 1gb. |
Week 43
Improvement | On the User Experience page - Tab Microsoft Teams we added links to the numbers where we talk about calls. When clicked, these will take you to the Call list (full list, not filtered list) |
Improvement | On the same tab, we rewrote several tooltips to give more clarification on the numbers shown |
New | On the Teams Versions report, an extra column was added to indicate if a device is 64bit |
Fix | We removed the preview flag from teams versions report as it is no longer preview |
Improvement | In the App Status overview we made it so that if you click on an app it opens the side bar with additional details and if you click again it closes it now (Toggle app tile) |
Improvement | In the Microsoft Status page, when you clicked on a service to see the incidents, These are now sorted by classification (incidents first, advisories second) and last update time |
Improvement | We reduced ingested and stored scan data (storage size and data ingestion impact) and improved performance when using the data |
Week 39
Type | Description |
New | User details: The user details page has been restructured. At the top we now show you key events (blue) and alerts (red) that took place during the selected period for: device (CPU/RAM), networking (changes in network and wifi used), applications (installations, removals & updates) and Teams (consecutive problems with audio, video and screen sharing). This allows you to see what key events are taking place at and around the time problems occur. |
New | User Details: Under the section Networking TrueDEM now shows you a visual representation of the users connectivity journey when using Teams. From device, local network (including wifi), ISPs and Microsoft network. This allows you to see the route the user is taking as well the hops and time needed to make the connection. For more details, you can click on an ISP to see the overall information for that ISP and the users currently using it. |
Fix | Outage Report: The percentage of users affected showed in certain cases the wrong percentage. this could even result in percentage over 100%. This has been corrected. |
Improvement | Outage Report: The list of incidents on which reports are generated has been extended |
Improvement | User Details: The section Applications has been extended. Apart from the list with recently installed, updated and removed applications, it now also contains a full list of applications installed in the device. |
Improvement | User Details: The Media Relay and Teams Versions and CPU utilization sections have been moved into the Teams Call Expanded Detail section. |
Preview | a new Live Teams Call Status report was added to the Microsoft Teams section (button on home). This report shows details about all ongoing calls in relation the networks they are being taken on. Apart from overall numbers on the number of calls, participants and bad/vs good calls, this report also show the situation per managed network. The networks are shown that have users in calls. A separate entry is for "Unmanaged networks". This is the aggregated list of monitored users connecting from other than managed networks (for instance home wifi).
|
Improvement | update of the Grafana platform to version 9.5.9 Note! This update contains changes to the interface of Grafana and means that the sidebar of Grafana has been removed. to access the OfficeExpert TrueDEM homepage, simply click the Grafana logo in the top left corner, or open the Home toggle menu in the right upper corner (below the Grafana logo) and select apps - panagenda OfficeExpert TrueDEM |
Week 31
Type | Description |
New | Microsoft 365 App Status: A new page that shows you not which API's are having problems, but what apps and functionalities are showing a degraded user experience. By giving you insight into the affected features and platforms, it's easier to determine if users need to be informed and if something is going on that requires attention. |
Improvement | Microsoft Outage Report: performance improvements |
Fix | Due to a change in Microsofts data representation, it could happen that in certain cases users who did have an agent were not showing as having any data. This has been addressed and all users with agents should be visible again at all times |
Improvement | Minor fix on the Teams Version list |
Week 29
Type | Description |
New | Microsoft Health Status: Redesigned details page for running incidents to make easier to see the updates |
Improvement | Microsoft Outage Report: Remove empty report lines |
Improvement | Microsoft Outage Report: Add Incident Number as file name |
Improvement | Export feature on multiple tables: Add descriptive file names |
Preview | We now Hide/Lock the "Go to Advanced User Details" button on the User Experience page if the customer is on TrueDEM for M365 |
Fix | We collapse all categories by default in the Teams Versions Grid view on opening |
New | We now show you the last used IP information on the Device Summary tab of the User Experience page if the user is in a managed network |
Improvement | Fixed bug with Teams versions view crashing when the categories were collapsed |
Fix | We changed the redirect URL to the new plans & features page on click of unlicensed (locked) items |
Week 25
Type | Description |
Preview | User Experience page received two new tabs Teams Call information & Device Information |
Improvement | The top section for the User Experience tab has been rearranged to show information about the user and location as the device information is now depicted on a separate tab. |
Improvement | Anew color scheme and other navigation enhancements have been implemented to make navigation more visible |
Improvement | Datetime format and locale now match with the Grafana setting |
Preview | A new report was added to show Outage information with the option to export a list of affected users. |
Preview | A new report was added under the MS Teams section to open a report showing information about the OS & Teams versions running on devices equipped with our agent. The report can be used to get insights into version distribution and allows for pivoting the data. |
Fix | Device Hardware Report: The column DeviceType had a trim function that would only allow the first 19 characters to be visible. This has been altered to show up to 128 characters. |
New | Environment status: The ISP list is now clickable. When clicked they will show the performance of the various workloads for the specific ISP. Note! Only the 6 ISP's with the most users at that moment are shown. In small organizations these subset numbers might be skewed if less than 100 users use the ISP. |
Improvement | Call List: Two columns were added showing the overall call quality for the call and a list of icons for the users. On mouse over the names can be seen and the column can also be used to filter for specific users. |
Improvement | Call List: The Duration column was aligned right for better understanding |
Preview | Call Quality Debug Level: A new section was added with two preview features: 1. A Sankey diagram depicting the relevant duration of particular problems like audio, video or other issues occurring for users in either the upload or download streams. 2. A table containing users with problems and the metrics that should be looked at for those users |
Improvement | Real Time Call Data - Details: We added a RAM usage graph and redesigned the CPU graph to a heatmap showing the top processes as well as a "Possible OS drivers" and "Other Processes" category. The 'crosshair' feature that allows you to mouse over one graph and will show an indication line now also works with the CPU and RAM graphs |
New | Real Time Call Data - Details: Changes like a change in WiFi network, codec or audio/video device used during calls are now highlighted. Both as text indicators at the top of each section as well as indicators in each graph. Move over with your mouse to see the change. |
Preview | A new Microsoft Teams Rooms view has been added to the navigation for easy identification and reporting on MTR's (Note! This feature requires separate licensing and will appear 'locked' if not licensed |
Week 18
Type | Description |
|---|---|
| Fix | Fixed a problem with the Tenant Wide Overview page |
| Improvement | column sorting/filtering enabled on all ISP pages |
Week 14
Type | Description |
|---|---|
Type | Description |
| Fix | The new Real Time call page now can now also be opened from the user search page and fully replaces the previous page |
| Improvement | User Details: Call List table now uses Real Time data for CPU & Memory usage |
| Improvement | User Details: Through the button in the top right you now have direct links to detailed user reports which will open directly for the right user & device |
| Improvement | User Details: Windows update history table was removed. Individual updates to windows components will be listed in the Added software table instead |
| Improvement | Agent Support page is renamed to TrueDEM Agent Status |
| Fix | Teams Version History & CPU graph fixed by using real time data |
| Improvement | Several old dashboards were moved to the Legacy folder and will in time be removed. These are obsolete or will be replaced soon |
| Improvement | New Monitored services were added to the Environment Health status page. These include:
Click on any of the services to see the status of monitored elements. |
| Improvement | The Application processes - Real Time Call Data - Details shows the top 5 CPU using processes. All other processes are now summarized into "Other User Processes" and "Possible OS & Drivers". |
Week 11
Type | Description |
|---|---|
| Fix | Fix on Call Quality Debug Level page to avoid Errors on the User Details page. The open User Details drill down link will now only appear if a pguid is available meaning that it will only show a link to the user details if the users device contains an EPM agent. |
| Improvement | User Details page: Added new table to Software Related Metrics Section with Information of which Software got added/removed |
| Improvement | User Details page: Realtime Monitoring Link (right top corner) will open liveV2 |
| Improvement | User Details page: The Call list now shows a new date/time column, representing the time a user joined the meeting. The exisiting meeting start time column was moved to the end of the table but is still available. |
| Improvement | The default homepage will from now on open the AppPlugin whenever you login to TrueDEM Portal or click the Grafana logo in the left bar |
Week 4
Type | Description |
|---|---|
| Improvement | Grafana was updated to version 9.3.1 |
| Fix | Fix applied to home page to fix missing data element |
| Fix | Fix applied to Call Quality Debug page to fix problem with links that do not show for people in certain situations |
| Improvement | New pages were added to show Environment Status and Microsoft Health for your environment |
2022
Week 51
Type | Description |
|---|---|
| Fix | Performance improvements to the Call Quality Debug page |
| Improvement | Restructured the collection of data to minimize impact on the agent/user |
Week 49
Type | Description |
|---|---|
| Improvement | On user details the existing graphs for CPU usage Over Time and Memory Usage Over Time now are filled by data coming from the Streaming Metrics data. This means that we now have data points at a much shorter interval. You can even zoom in to see more details. |
| Improvement | We added two new graphs on the User Details page in the Users' Network section to show Network traffic - Sent kbits /Sec & Network Traffic - Received kbits/Sec. These are also based on streaming metrics data. |
| Improvement | we added a table in the Teams Call Expanded Details section on the user details page to show 'Teams Voice Endpoint Latency' that shows you which endpoints are performing best or worst. |
Week 40
Type | Description |
|---|---|
| Fix | Fixed issue with data not showing in Direct Routing optimization |
| Preview | Version 2 of the new Real Time metrics page is released. The page can be accessed by changing the URL of the existing real time metrics page to include V2: ( .../live/... to .../liveV2/...) |
Week 37
Type | Description |
|---|---|
| Improvement | User Details page: Fixed problem with hover over on bar charts not showing a legend. |
| Improvement | User Details page: Adjusted the process tables to show only significant processes. A significant process is any process that was in the top 10 of processes consuming CPU at the scan interval plus any of a predefined list of processes we will always monitor (Teams, Chrome, etc). |
| Fix | Remove empty lines in Hardware report |
| Improvement | Routing map: We enhanced and added maps for all three tested workloads (Teams, Presence, Outlook). This changes the layout for the page but also now gives you the option to see the different routes your data is taking for different workloads |
| Improvement | On the Corporate Network Call Quality Report (Reports folder) Microsoft was removed as an ISP as it was confusing and could lead to inaccurate conclusions. |
Week 36
Type | Description |
|---|---|
| Fix | Fixed several errors that could cause red errors in certain dashboards |
| Improvement | User Details page: We moved the OneDrive info into a separate section at the bottom of the page and changed the graphs. |
| Fix | Fixed a problem on the call list where sometimes calls were shown more than once. |
Week 34
Type | Description |
|---|---|
| Fix | The User Search page only requires search strings of 3 or more characters |
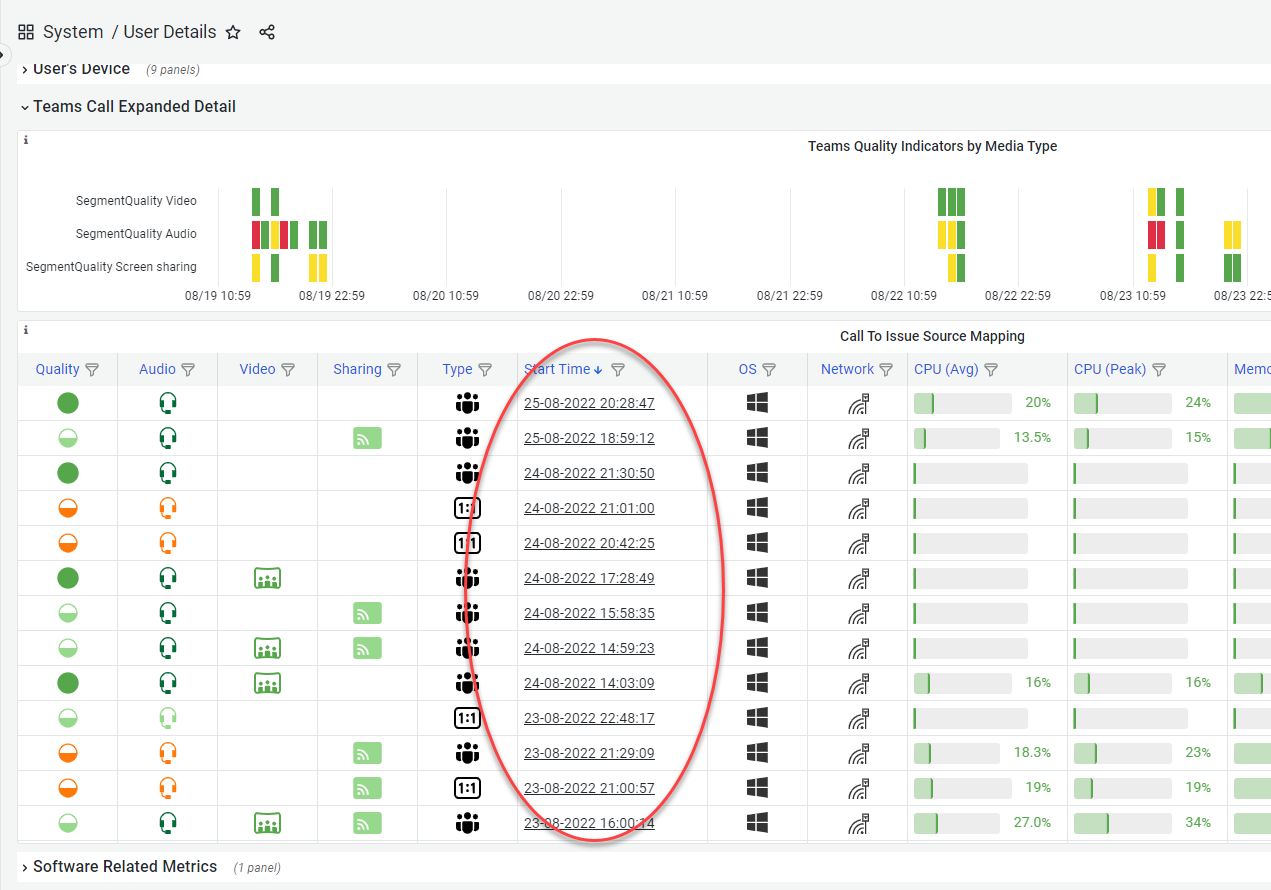
| Improvement | User Details page: In the section "Teams Calls Expanded Details", the calls in the list are now clickable and will take you to the call details page for that call.
|
| Fix | Interface improvements for consistency |
Week 33
Type | Description |
|---|---|
| Improvement | Removed obsolete graph panels on the Microsoft Services dashboard |
| Improvement | The New portal homepage is now dynamic. Meaning that we can release new pages to customers more quickly (this will happen soon!) |
| Improvement | User Details page: The values for Last Reboot Time and Device Model were added tot the page header. |
Week 30
Type | Description |
|---|---|
| Improvement | On the Agent Support page, the bar charts are now clickable & exportable |
| Improvement | Real Time metrics page:
|
| Fix/Improvement | in the Exports of lists from the new App:
|
| Improvement | Agent History Report:
|
| Improvement | Real Time metrics page:
|
| Improvements | Tabs in the portal app now show the name of the page |
| Improvements | Logo on all app pages is clickable and takes you back to home page |
| Improvements | We removed some icons from links and show only an icon if we open that link outside the current tab ('jump out') |
| Improvement | Improved ISP Overview page renders the ISP Overview by ASN page obsolete. The obsolete page was archived |
Week 28
Type | Description |
|---|---|
| Improvement | The Real Time Metrics page showing metrics during calls now shows pre-loaded historical data from earlier in the call |
| Fix | The number of "failures to connect" and "mid-call drops" on the Tenantwide Overview page was corrected as it showed incorrect values in certain cases. |