Page History
This page gives you a quick overview about the health state status in your environment configuration and is therefore displayed per default after the login (unless you have defined a dashboard as the homepage, see Dashboard).
It divides into two main sections:
...
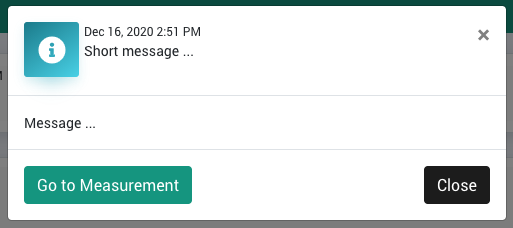
Clicking on a message opens a pop up with more details. Click on the Go to Measurement button in this pop up to open the respective measurement in the Sensor Overview:
Grid
In the Grid section you will see a list of your servers with the corresponding measurements:
...
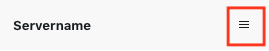
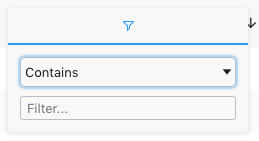
The Servername column can be filtered - clicking on the following icon opens the filter dialog (hover your mouse over the column heading to display the icon):

Data Analysis
The right click menu opens several options to further dive into the data:
...
The Add to Chart... action opens an instant ad-hoc chart directly within the Health Grid.
...