Introduction
We have released recently a blog entry ( http://blog.panagenda.com/blog/?p=880 ) where we have mentioned couple of new Domino 9 server statistics.
This Article will go one step further where we show you how you can make use of the new stats in your environment via GreenLight.
Example
Configuration
First of all we need to have a Domino Statistics sensor in place which monitors the Domino 9.x server. Please make sure that there is no restriction specified in the Statistic Filter field (Settings TAB).
Alerting in case a critical view is unavailable
-Create an action (SMTP, Sametime, …)
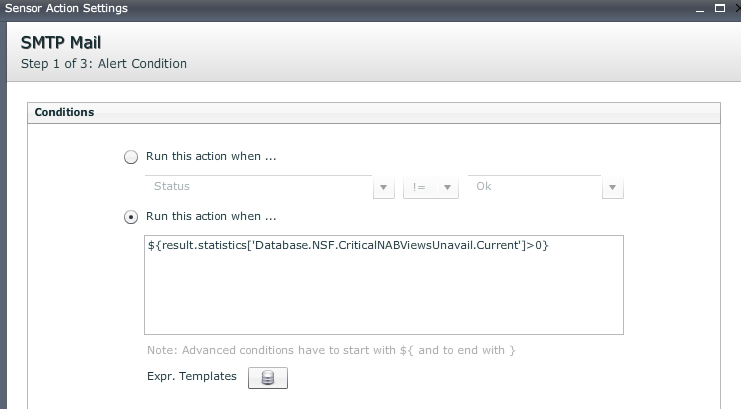
-Select Run this action when… and delete the existing line in the field
-Click on the Expr. Templates icon so that you get the list of all available “expressions”.
-Because we know a portion of the statistic name, just enter “critical” in the filter field
-Double click on the ${result.statistics['Database.NSF.CriticalNABViewsUnavail.Current']>} value
-Add at the end of the line >0 so that you have the following string in place
${result.statistics['Database.NSF.CriticalNABViewsUnavail.Current']>0}
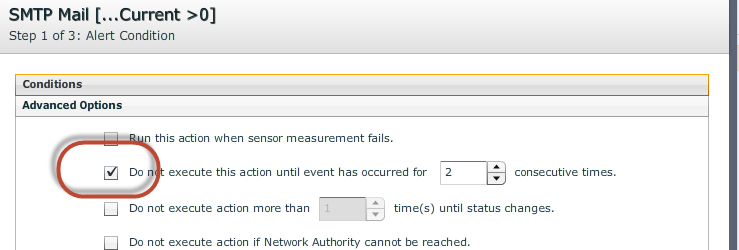
-Optional: Expand the Advanced Options section and define the following settings
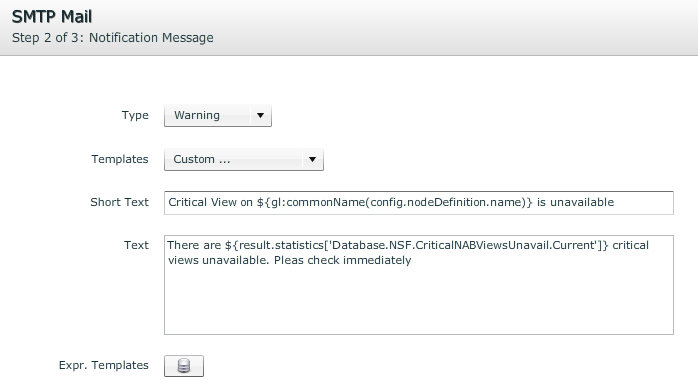
- Click next and populate the Notification text:
-click on next and select a mail profile
FINISH
So whenever there is more than 1 critical NAB view unavailable for at least two measurement cycles (Advanced Options), you get a notification alert sent via SMTP.
Charting
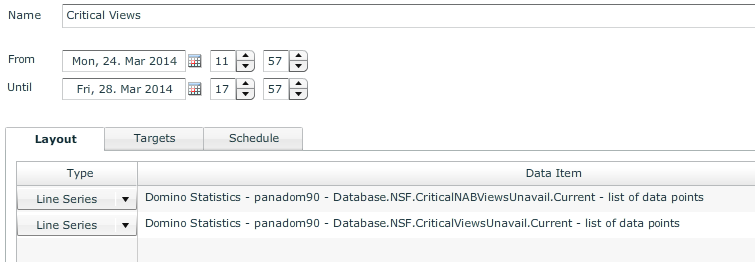
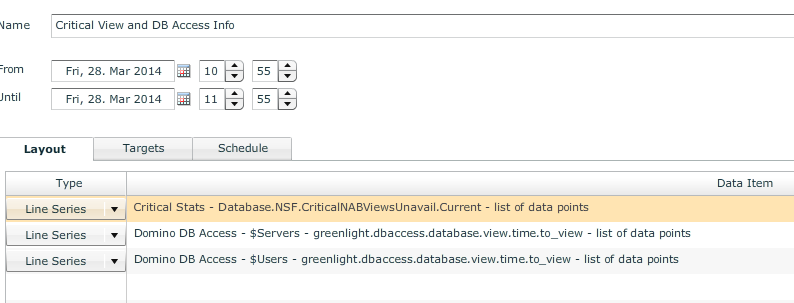
To depict a line chart which shows you how often a critical view of the NAB and a DB was unavailable, just do the following.
-Create a Line Chart and add line series for:
Database.NSF.CriticalNABViewsUnavail.Current
Database.NSF.CriticalViewsUnavail.Current
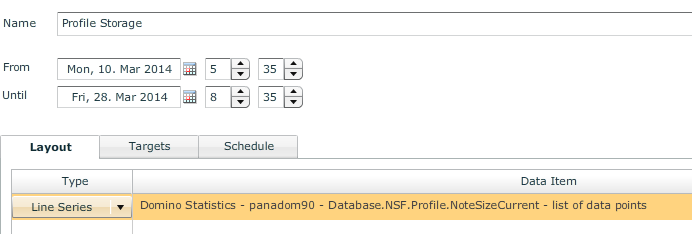
Charting to Depict NSF Profile Sizes
To depict the total size of all your NSF Profiles of a Domino Server via a line chart, just do the following.
-Create a Line Chart and Add the line series: Database.NSF.Profile.NoteSizeCurrent
Combine Critical View Information with the DB Access Sensor information
You can even go one step further in combining the Critical View Information together with the DB Access sensor elements.
Just create two Domino DB Access sensor where you monitor the $Users and the $Servers View from the names.nsf. Those two views are reporting to the CriticalNABViewsUnavail.Current statistic in case they are unavailable.
Find below one Line Chart example
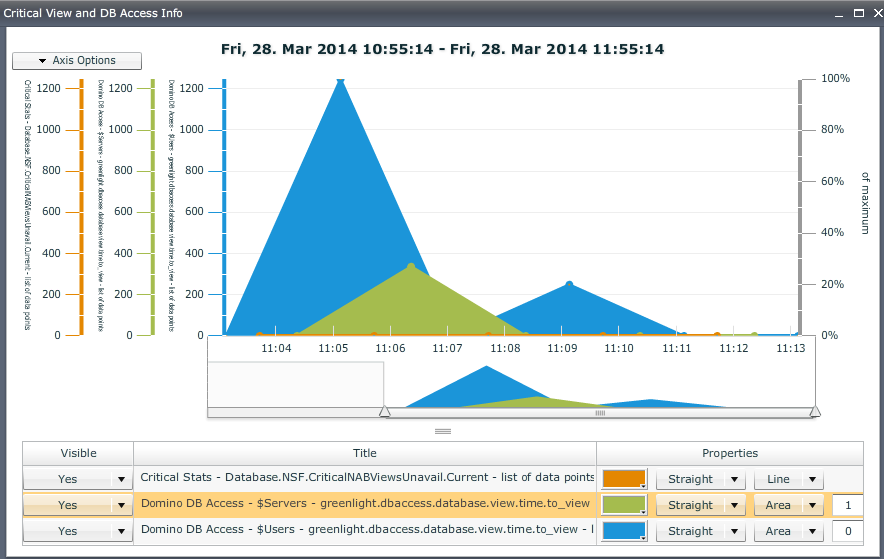
So we grab the Info from the Critical NAB View statistic and compare this with the values coming from the DB Access sensor.
You may get the following graph
So whenever the CriticalNABViewsUnavailable reports “1” you may easily see which view name is having issues at the moment (one of the views - $Users or $Servers - will indicate a high access time)
Conclusion
With the new statistics IBM provides a full set of new possibilities. So you can expand your monitoring in a way where you get notified in advance for specific critical views.


