On opening the database instance details, you will be presented with a header that contains general information about this specific instance. Keep in mind that if a database has multiple instance in its replica set each of them will be analyzed separately and classified separately. This is done deliberately to ensure that you get the most accurate information.
A database might for instance have replicas on three servers but all usage might only be taking place on one server. Also, due to replication restrictions or problems, it is possible that the design on databases sharing the same replica id is not the same.
Therefore, the usage, design and ranking information portrayed in the top is all instance based.
In this Topic:
Application
The Application tab is divided into three sub tabs (left side)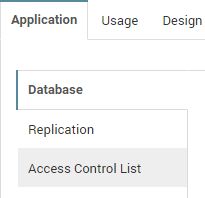
Database:
Displays general information about the database instance as taken from the database properties, the size of the database instance, the template it inherits from (or is), whether it is listed in the Domino catalog and whether it is included in MultiDB indexing.
Replication:
Indicates whether replication is enabled and which settings have been activated
Access Control List:
Gives information about how many entries there are in the ACL with a specific level of access and which level of access special user entries like "Default" and "Anonymous" have.
Other Instances (x)
This tab is only visible if other database instances have been identified that share the same replica id. If there is no tab for instances then no other replicas were found on the analyzed servers. The value between brackets behind the tab name indicates how many other instances share the same replica id.
Each instance will be identified with its own tab showing that instances "Application" details and a button to open the full analysis details for that instance.
Keep in mind that multiple instances with the same replica id can exist on one server.
Views
The Views tab shows information about the number of views an instance has, their size and usage. It has two tabs. One that holds general overview info like usage and number and type of code blocks/lines while the second tab lists all the views in the database with their
individual settings, size, code elements and when they were last accessed. This information can help you determine which views are actively being used or not and which views are perhaps taking up unnecessary space in your database.
Additional columns can be made visible by clicking the + icon above the column categories: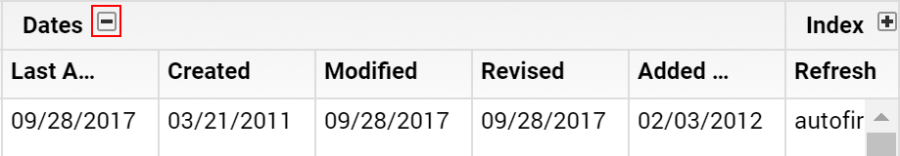
Usage
The Usage tab gives you specific information about how the database instance is being used and by whom (departments). The Usage tab has three sub tabs that show specific information. The user activity tab shows you the number of sessions and the Active Users per period in the instance, split out to Web and Client activity.
The second tab splits out the Session data to read/write activity as well as giving you the amount of data being uploaded/downloaded. Making it possible to get a more in-depth view into how the application is being used and for what purposes.
The third tab (if activated in your organization) shows information about the usage per department. Showing the various departments that use the database, their usage specifics (like number of users, Access days and download/upload activity.
The Department Tree allows you to sort either alphabetically (by department name) or by most active (Session Count):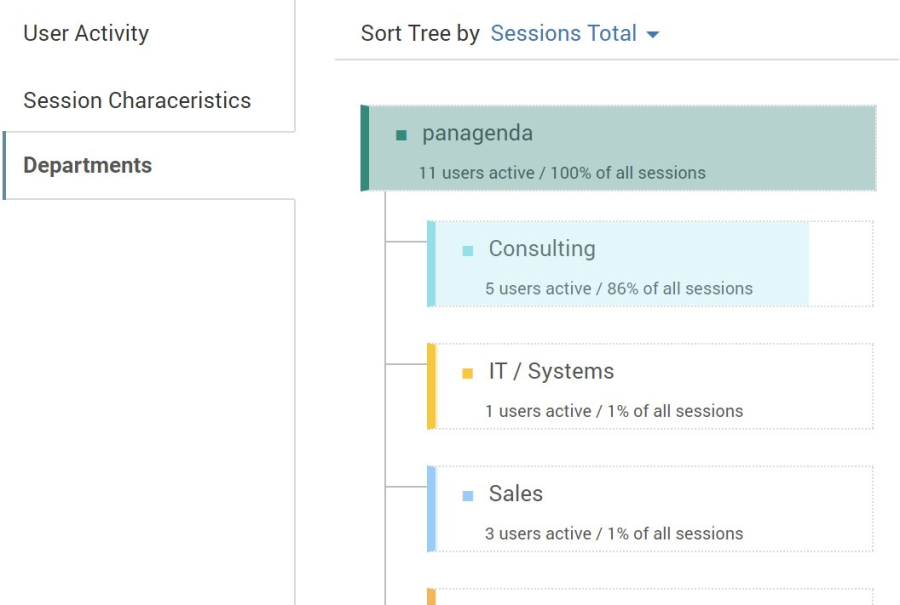
Each department tab shows you the number of users active in the instance from that department and the percentage of sessions generated by them. To drill down into sub departments, click on the departments themselves which will open (if available) the next level of departments as well as an overview for that departments usage details. These include information like when the instance was last accessed over the web, number of sessions upload/download details. By clicking the "User List" tab in the top you can even get a list of users accessing the database from that department in the given period with the date they last accessed it and the session and upload/download characteristics of each user. 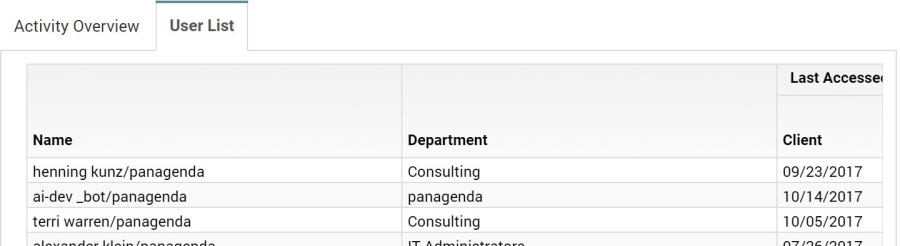
Note
Organization information is taken by default from the contents of the department field in the person document for each user in the Domino Name & Addressbook. Your administrator can deactivate this or change the collection process to collect from a different source. Please refer to the Setup Guide for details on how to do this.
Having these detailed insights into the usage of the instance can help you determine various things. Like which department and or user would perhaps be a logical choice to 'own' an application (in case no business owners are known), whether a specific instance needs to remain as a separate replica or could be consolidated / removed and what the impact to specific departments would be of changing / removing an application.
Design Complexity
This tab is only visible if a design analysis was performed on the database and if it is in scope.
The design complexity tab gives insight into the design elements of the database. Giving you the totals for each type of element being used, how many of them contain code – and what type of code as well subsidiary elements like fields, subforms, etc. are being used. Additional information is given in the sub tabs per design element type that can be clicked on the left side.
LOC stands for Lines of Code | Ø for average | # for number
Design Similarity
The Design Similarity tab is where you will be able to identify databases with near similar designs. Regardless of whether they share a template or not.
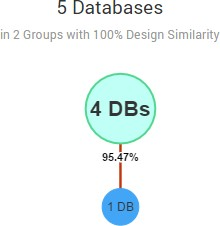
If an instance belongs to a similarity cluster (meaning it shares a design that is for 95% or more similar to that of other instances in the environment) this tab will appear.
On the Similarity tab each node in the diagram represents a sub-cluster consisting of 1 or more instances which share the exact same design. The top node represents the design held by the instance whose details you are currently reviewing. The other nodes represent sets of instances with near similar designs.
In the right-hand side pane, the system will show you suggestions for the most likely Template candidates (if available) and how many instances are already referencing them.
By clicking on an individual node, you get to see additional info about the instances sharing that design. Like the names and templates each instance inherits its design from (if applicable). By holding the CTRL key and selecting multiple nodes you can then identify which other database are sharing a near similar design and could potentially be candidates for template consolidation.
To open one of the near similar design databases, simply click on the title in the details pane on the right.
Design Insights
This tab is only visible if a design analysis was performed on the database, if design findings were found and if it is in scope. In all other cases the tab will not be visible
This tab is where panagenda ApplicationInsights helps you identify potential problems and challenges in the code of your database instance design.
Based on a predetermined list of criteria (rulesets) panagenda ApplicationInsights identifies certain occurrences or combinations of occurrences in your code that could require attention in case of optimization, modernization, transformation or migration.
Findings:
Findings are categorized into ruleset categories like:
- Web Design
- Mail Dependencies
- Special Interfaces
- Operating System Dependencies
- Dependencies On Other Databases
- Specific Code Findings
- Additional custom rulesets you define
Each ruleset can be opened (double click) and will list the type of findings in that category and the number of occurrences in the code. Each finding criteria has a weight that help identify the potential risk of the finding. This is indicated by the color of the finding label.
Findings classified as more high risk/more complex are shown as red while less important findings would be indicated with green. 
Each finding category can be opened to review the individual code snippets and their location. 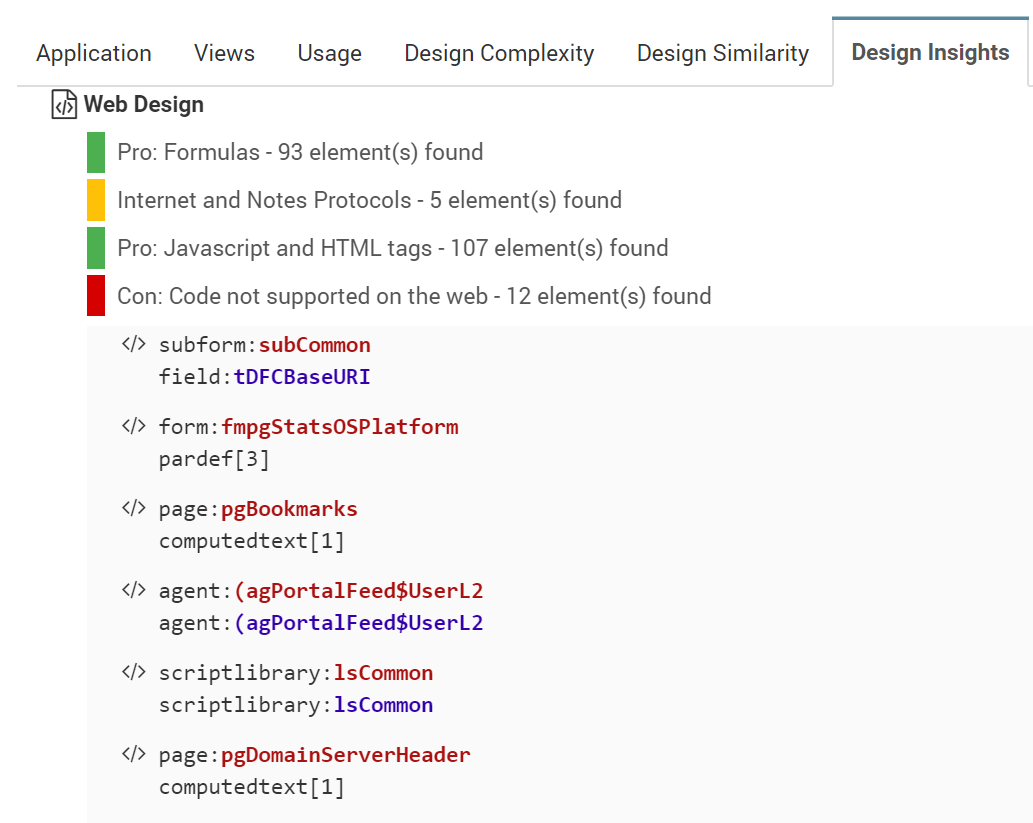
Each finding lists the design element type, design element name and the action in which the code is located. It also lists in how many other applications that code element can be found.
Not only does panagenda AI give you the indication of what code elements could be problematic, it also tells you in how many other applications the same code is being used. Allowing you to plan more efficiently and replace code across your platform as you go.
To view the affected code simply click on the element block. The code will appear in the right hand window.
The affected code lines are highlighted in yellow and their location is visible in the right scroll bar for easy navigation. Use the "<< previous" and "next >>" buttons in the top of the code window to easily navigate tot the affected code lines.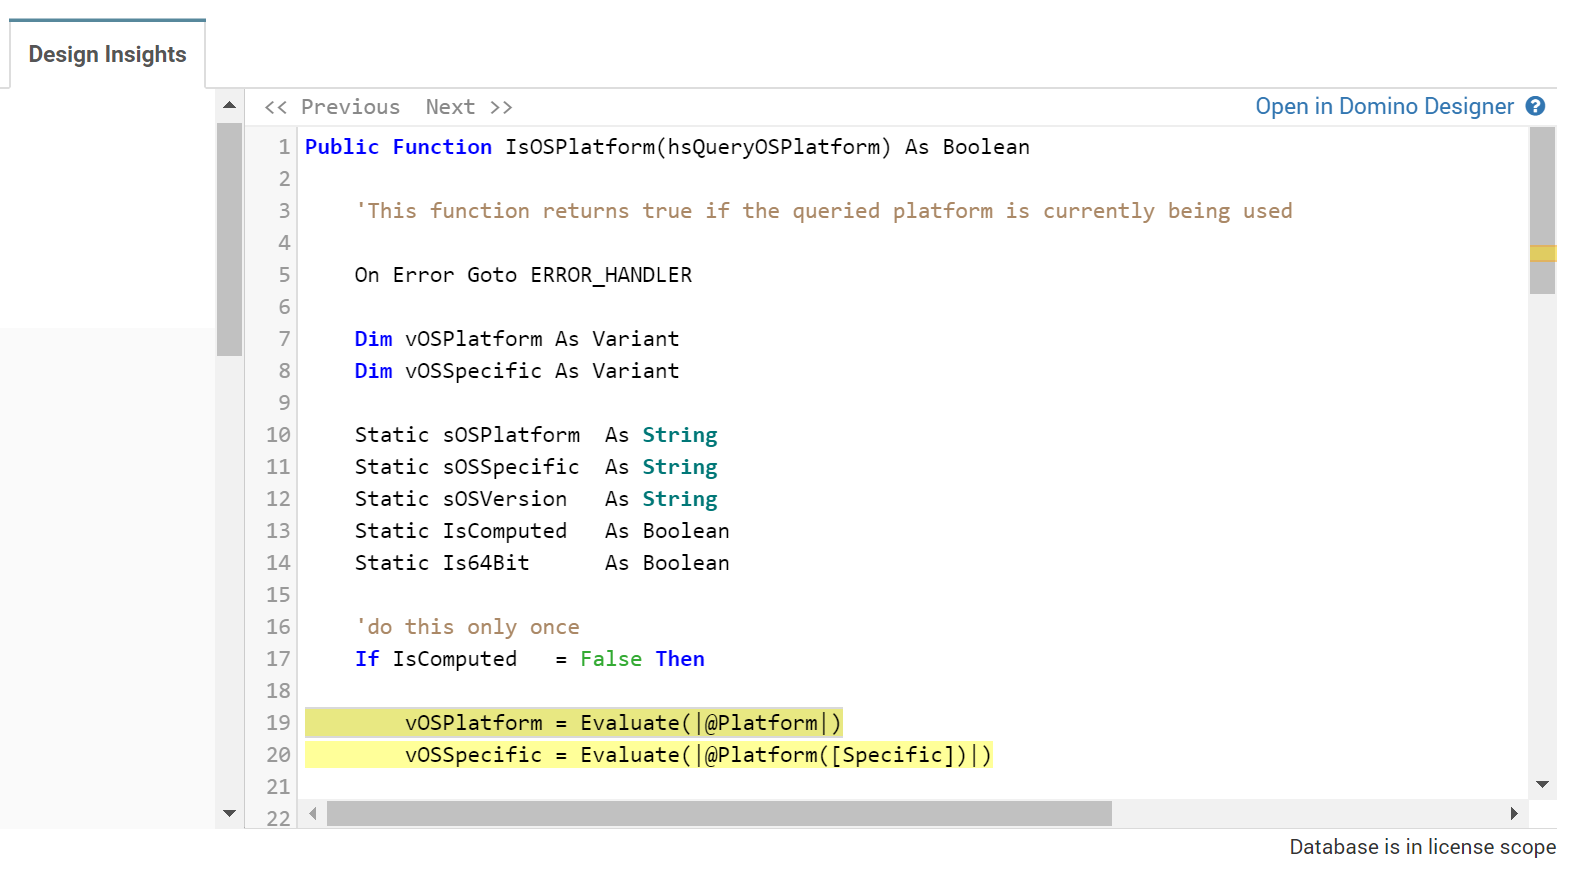
Use the "Open in Designer" button in the right upper corner to open the specific design element in the Notes Designer client directly. This does require that the Notes Designer client is installed and that you have access as a Designer to the specific database. For the "notesdesigner://" links that this button uses to work you will also need to install the panagenda Application Designer Helper as well. To download and install this please refer to: https://www.panagenda.com/2017/10/open-in-designer/.
Next Topic: