Introduction
This new functionality performs numerous checks on server health, performance and configuration in order to provide information on how the according areas can be improved. Based on IBM recommendations and community expert suggestions & best practices, this feature offers immediate value and helps to easily identify issues and tuning potential. It can be found in Live Monitor under the new tab "Audit Overview". An indicator is also available for the Health Grid, for a basic overview of the audit status.
Configuration
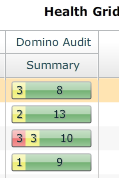
One of the requirements for getting Domino Server Audit Information is that you have a Domino Statistics Sensor active. As soon this sensor grabs the latest statistics from the Domino Server, the Domino Audit column on the Health Grid Dashboard provides you with the following output.
In total, the Domino Server Audit contains up to 17 individual Audit reports. The numbers shown in the colored bar chart above are indicating that some of the Audits are reporting a critical (red), warning (yellow) or OK (green) status.
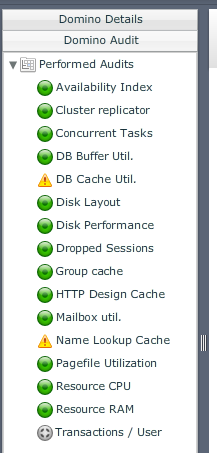
In order to get detailed information, double click on a server in your Health Grid Dashboard and click in the left bottom corner on Domino Audit. You should get something like this.
If you select one of the audit reports, you get further information.
We distinguish between simple Audits like the Availability Index Audit, which shows you basically what value the Availability Index had during the last measurement, and more complex ones such as the NameLookupCache Audit.
For instance if the Availability Index is below 10% we report a critical status (red) in this Dashboard.
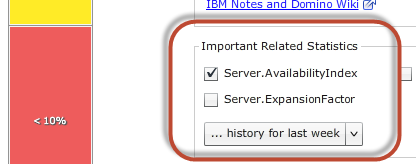
It is pretty important to know that the bar chart demonstrates just the situation from the last measurement (snapshot). If you like to see the history of the availability index, you can simply trigger a Chart out of the Domino Audit Section.
For instance select Server. AvailabilityIndex and click on “… history for last week”
The Chart will depict you now the history of the Server.AvailabilityIndex. So it’s pretty handy that you can create such charts right from the Audit Section without going to the Charts Menu.
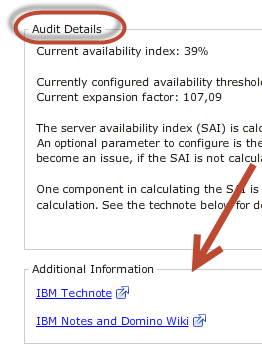
In addition to that information we help you to understand the facts and figures and to point you in the right direction how you can solve/sort out the issue (in case you have a warning or critical status). The Audit Details provides you this information dynamically. With dynamically we mean that depending on the status, the Audit Details text information section changes. So you will see a different Text if the Status is OK compared to a Critical status.
Last but not least we provide you with the correct IBM Technote URL’s for more details.
Conclusion
The Audit helps you identifying issues in advance before users are reporting a possible unavailability of your Domino service.
This is the first part of a Domino Server Audit series in this knowledge base.


