Introduction
This kbase describes several examples of which Websphere Topics one can monitor with GreenLight.
Configuration
First configure the Websphere Connection
1) Download Connections Shell Script Sensors (Note: this is NOT necessary if you are using GL >v3.5!)
IBM Connections:
Download and Extract the files to /opt/panagenda/scripts/gl_sensor
2) Create Linux Shell Script Sensor - GreenLight UI
EXAMPLE: Script Filename: WasAppStatus
-create a LinuxShellScript Sensor
-enter "WasAppStatus" (v3.2 appliance) or "was_appstatus" (v.3.5 appliance
GreenLight version <=v3.2: This is one of the files which you have copied over to /opt/panagenda/scripts/gl_sensor in Step1
GreenLight version >=v3.5: on GL v3.5 Appliance the Shellscript Filenames are different!
Checkout the filenames in the following folder: /opt/panagenda/appdata/volumes/gl/scripts/gl_sensor/
-Parameters:
parameters_st.properties
soap.client_st.props
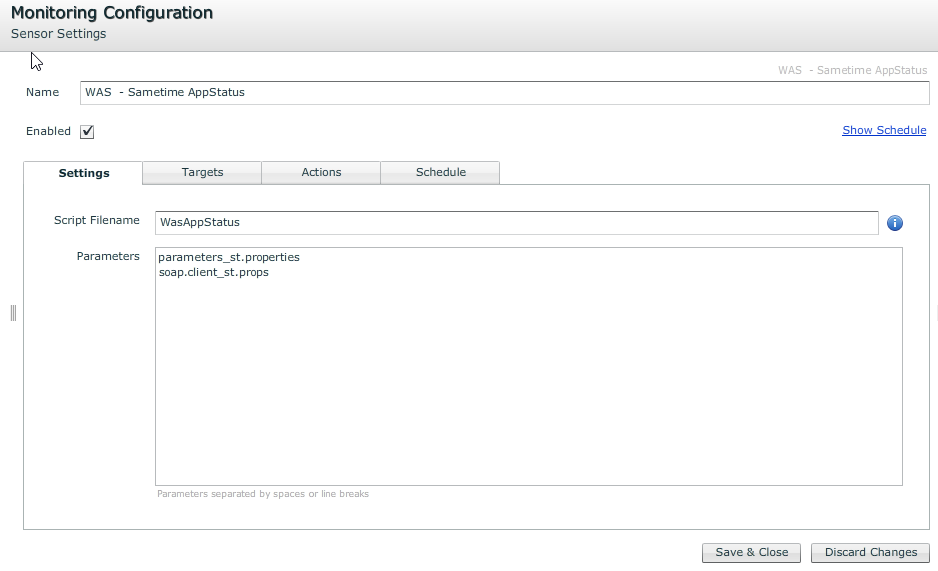
-Define on Target level your Connections FQDN (e.g. connections.mycompany.com)
-save/close
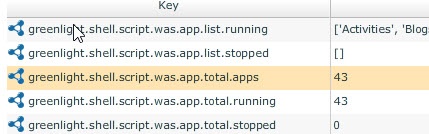
Output
As are result you are going to get for ANY installed application the Status (running, stopped, not available)
example:
What other Scripts are available?
You can do now the same steps for the remaining Scripts
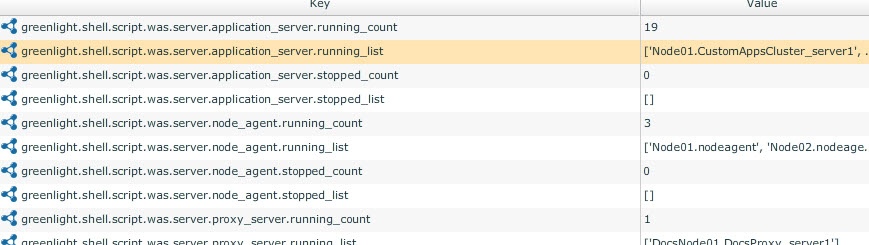
- WasServerStatus.sh (was_serverstatus.sh)
Monitors each WAS server
- WasDataSource.sh (was_datasource.sh)
Monitors WAS Datasource Connectivity (e.g. is WAS able to connect to the DB2 Datasource of Connections?
- WebSrvStatus (was_websrvstatus.sh)
Monitors all Webservers within the Cell (stopped, running)
- Messagebus.sh (was_messagebus.sh)
Retrieves pending messagebus information from any queue!
- WasJVMHeap.sh (was_jvmheap.sh)
Retrieves JVM Information such as Xmx, Xms, etc...
- WasPMIConnectionpool.sh (was_pmi_connectionpool.sh)
Retrieves PMI Information of JVM processes and Webpools (ActiveCount, Poolsize,...)
- WasPMIPerf.sh
Retrieves PMI Information of JVM Processes (Used Memory, Free Memory,. ...)
- WasVariables.sh
Lists all WAS Variables