Introduction
You may have the situation where you would like to monitor the availability as well the functional ability of a Domino HTTP Server. In order to cover this area GreenLight provides you multiple ways on how to monitor that.
Multiple Ways (independent from each other):
- via Domino Statistics Sensor
- via Domino Task Sensor
- via HTML User Simulation Sensor
This example will show you how easy you can use the results from all three methods to generate a single depiction of the collected and stored values.
Example
Configuration
Create a Domino Statistics Sensor
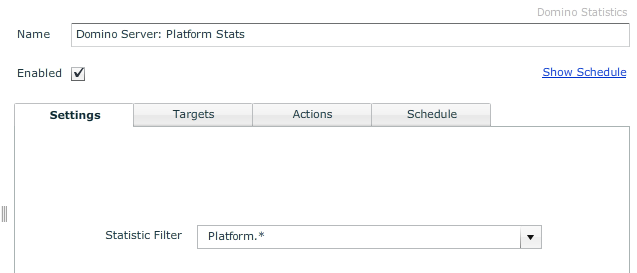
The plan for the following configuration is that we want to monitor the CPU percentage utilization specifically for the HTTP task. For this reason we plan to collect only Platform statistics with this Sensor. (Make sure that Platform statistics are active on the Domino server, otherwise you would not see any of those statistics)
On the Settings Tab, enter Platforms.*
Specify a Target, Name and Schedule for this Sensor definition
Save and Close
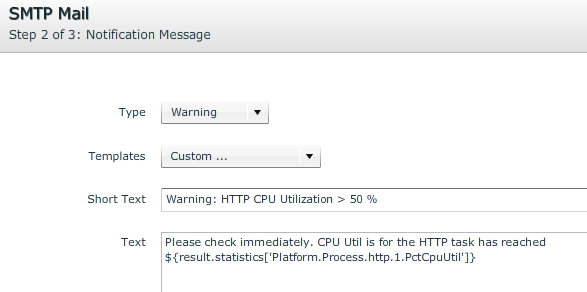
Create SMTP Mail Action for this Sensor
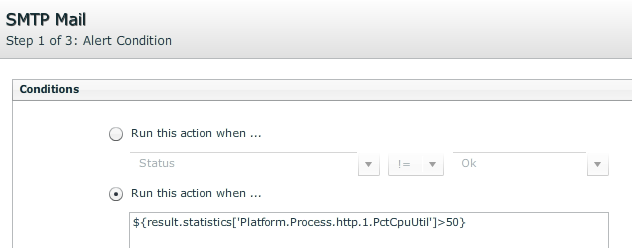
An e-mail should be triggered if the CPU Utilization is greater than 50%
Specify the following condition: ${result.statistics['Platform.Process.http.1.PctCpuUtil']>50}
Leave the Advanced Options
Choose a Mail Profile and click FINISH
Create a Domino Tasks Status Sensor
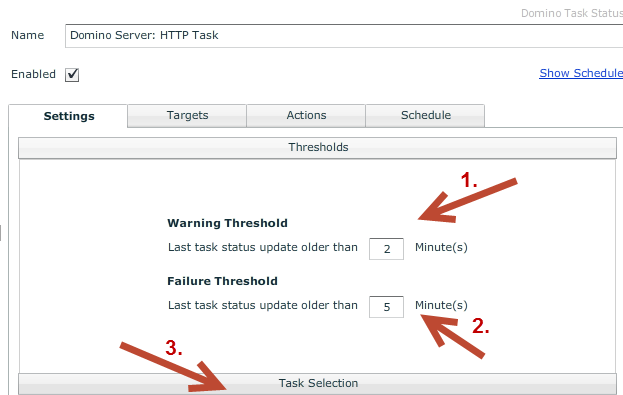
This Sensor definition will give you details about the http task “age”. A Task age for instance of greater 100 sec would/could indicate that the http task get stuck for whatever reasons. So if a Domino becomes unresponsive the task age increases.
On Settings Tab choose the Warning and Failure Threshold
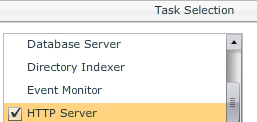
Click on Task Selection and select just HTTP Server
(for this example we don’t want to monitor any other tasks)
Specify a Target, Name and Schedule for this Sensor definition
Save and Close
Create SMTP Mail Action for this Sensor
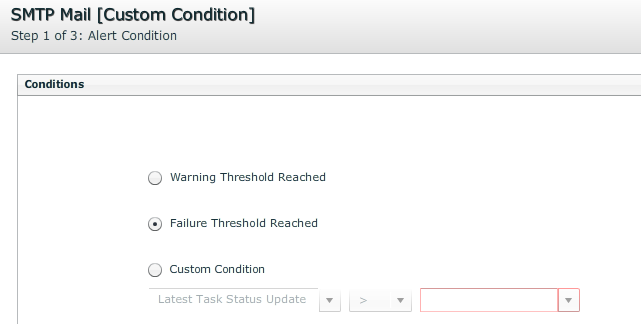
An e-mail should be triggered if the Failure Threshold has been reached (in our case 5 minutes)
Click Next
Click Next (leave the default text)
Select a Mail Profile and click on Finish
Create a HTML User simulation Sensor
With this one, we want to measure mainly the response time of the Web Server.
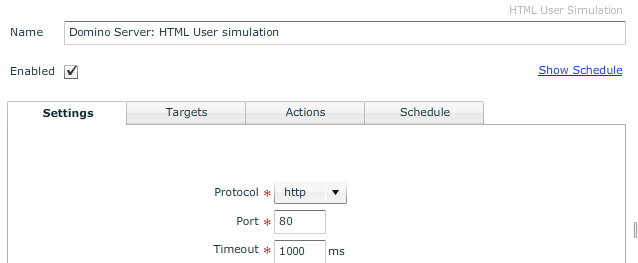
On Settings Tab specify the Protocol, Port as well the Timeout figure
Specify a Target, Name and Schedule for this Sensor definition
Create SMTP Mail Action for this Sensor
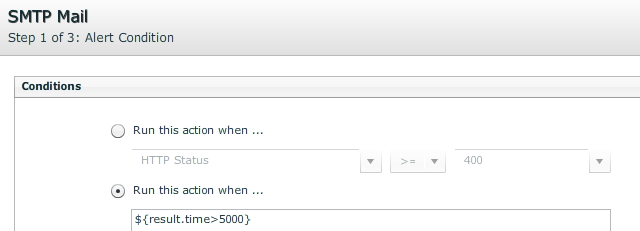
An e-mail should be triggered if the response time of the webpage is more than 5 seconds.
Enter: ${result.time>5000}
Leave the Advanced Options unchanged
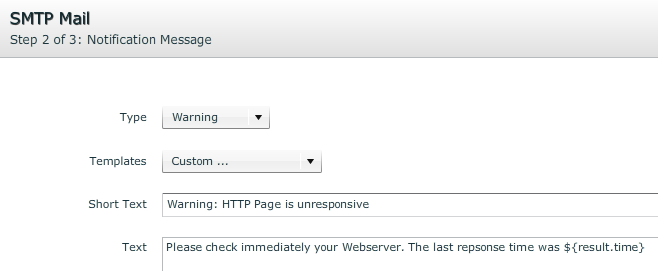
Define the following text
Select the right Mail Profile and click on Finish
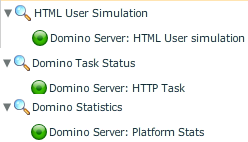
You should have now the following three Sensors in place:
The alert e-mails will look like in the following style:
Up to now we explained how to monitor your HTTP Web Server and how you can trigger certain actions based on specific conditions. The upcoming section will demonstrates the power of “charting” where a combination of values from the above sensors will depicts a historical graph.
Create a Line Chart
Now let’s create a line chart and select the following three statistics. You need to select first the name of the Statistic sensor followed by the item.
For instance:
Click Next
Make sure you leave the Ascending Value Filter disabled
Repeat the steps with the other two statistic parameter so that you end up with the following configuration:
Make sure to add the correct Target as well to specify a schedule and a name for this charting definition.
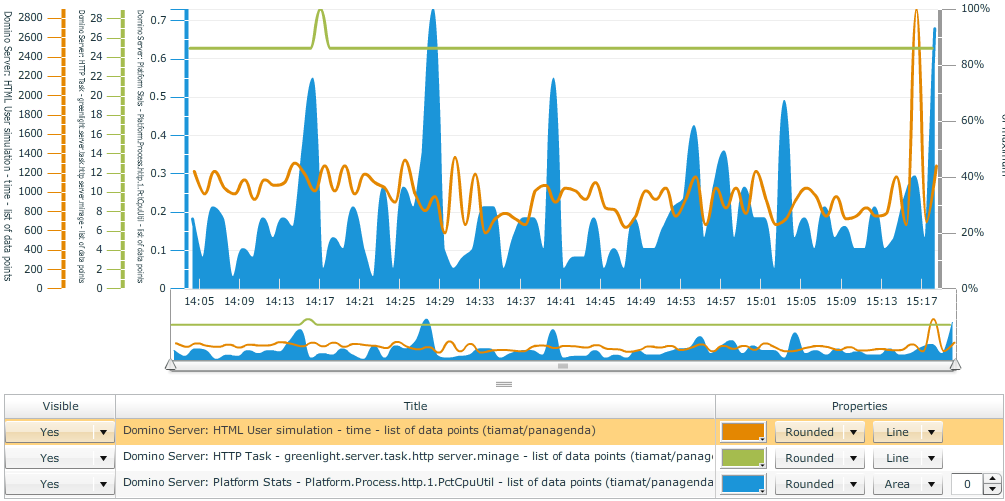
Whenever you have done this, just generate the chart.
The chart will show you how all three values have evolved over time. So an increase in the CPU Utilization correlates with the response time of the webpage.
Conclusion
As seen above you can build simple HTTP monitoring rules based on the GreenLight Sensors. The Action templates offer different notification styles in which you specify your own condition.
With such configuration you get informed in advance before the server may run into an issue. With the Charting Engine of GreenLight you simply visualize the collected historical data of your Sensors.

