Introduction
Part 1 of a Performance Counter Use case:
How to monitor Disk space issues on a non Domino Platform and how to configure the notification
Configuration
First of all you need to make sure that you have selected the necessary Performance Counters on the Node Level
In this example i have selected the following
Afterwards you should check the measurement output of the sensor
- double click on a server on the health grid and click on statistics
double click on a key which you wan to use for alerting purpose
(now you have the key/value pair in the clipboard)
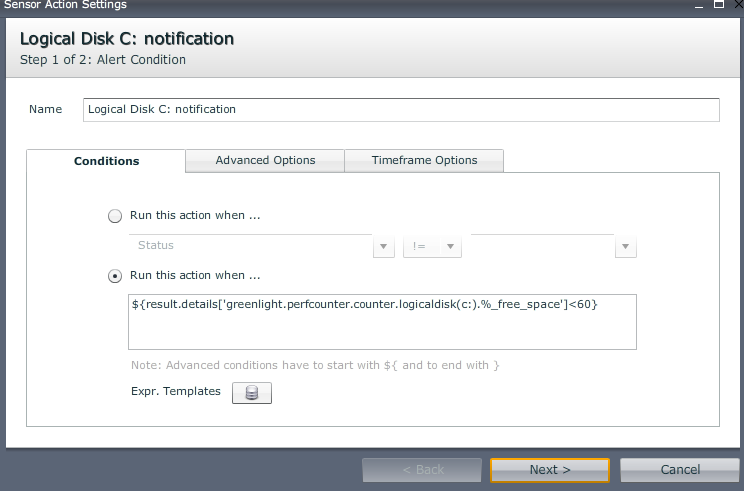
Now let's create an action
enter the condition string:
example: ${result.details['greenlight.perfcounter.counter.logicaldisk(c:).%_free_space']<60}
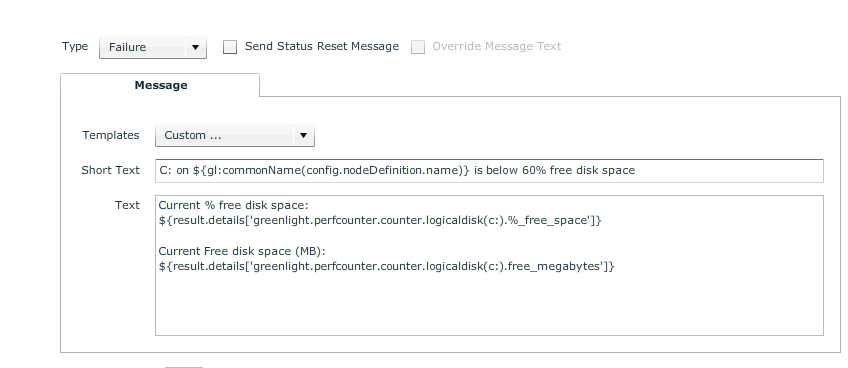
enter the Alert notification text:
example:
Current % free disk space:
${result.details['greenlight.perfcounter.counter.logicaldisk(c:).%_free_space']}
Current Free disk space (MB):
${result.details['greenlight.perfcounter.counter.logicaldisk(c:).free_megabytes']}
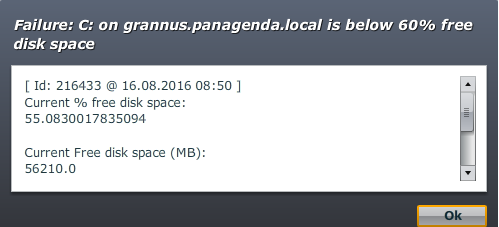
The notification would look the following (if the free disk space falls below 60%)
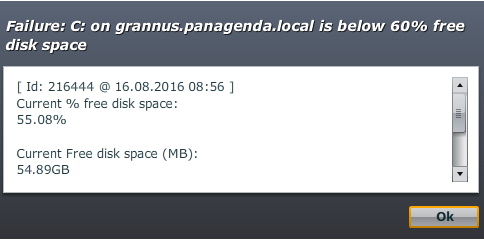
If you want to make it a bit nicer , adjust the text
Current % free disk space:
${str:substringBefore(result.details['greenlight.perfcounter.counter.logicaldisk(c:).%_free_space']*100,'.')/100}%
Current Free disk space (MB):
${str:substringBefore(result.details['greenlight.perfcounter.counter.logicaldisk(c:).free_megabytes']/1024*100,'.')/100}GB


