General Information
Welcome to panagenda ApplicationInsights!

This document will help you understand what panagenda ApplicationInsights is, how it works and how you can use it within your organization.
What is panagenda ApplicationInsights?
panagenda ApplicationInsights (also referred to as "AI" in this document) is delivered as a virtual appliance that provides continuous and detailed information on IBM Notes / Domino application usage and design in the form of easily understandable graphs and visualizations. It offers reports on design complexity of applications and gives insights into the application landscape for optimization, migration, modernization and transformation purposes. panagenda ApplicationInsights offers administrators, developers and management the means to plan, manage execute and monitor a Domino application modernization strategy.
In order to do so, AI provides:
- Environment and inventory overviews
- Insights into usage from IBM Notes Rich clients and browsers
- Usage information per hierarchical department and user for analyzed databases
- Analytics on design and source code complexity
- Detailed „Design Insights" based on source code search patterns
- Design similarity and identification of „Template Candidates"
- Continuous collection of data (overview, usage and design changes)
- The option to define your own custom insights
- Platform wide code searches
Key use cases for panagenda ApplicationInsights
There are several use cases in which you will find that panagenda ApplicationInsights can help. The three key areas are:
- Optimization
- Modernization
- Transformation
Optimization
Reduce costs by optimizing the number of applications and servers and by archiving or sunsetting applications, or instances of applications, no longer needed.
Removing unused applications and database instances reduces load, improves maintainability and improves the cost-benefit ratio.
AI can help you, for instance, to identify archiving, sunsetting and transformation candidates in the following ways:
- If an application is mostly used read-only: you could for instance choose to archive, sunset or perform a content migration (to IBM Connections, for example)
- If an application is not used at all (after, say, 6-12 months): You could choose to close down access to the database and if no-one complains after e.g., 3 months, archive it.
Modernization
By providing insights on usage and design, AI allows you to make founded choices about enabling select applications for mobile and/or browser use.
For instance to refurbish select applications used by a large amount of users or a high-profile group of users and departments (e.g. board of management, sales department, profit centers, etc).
To help in this modernization process, AI helps to answer questions like:
- Which applications are worth investing in? Usually those showing high activity or are used by key departments.
- If invested in, which applications pay back fast? Applications with exceptionally complex design may be expensive to modernize, for example, so focus on lesser complexity.
- How can I optimize my modernization investment? Applications that share a lot of design similarity with others, pay back faster, as – having modernized one, could implicitly also modernize all mostly similar applications.
- Which applications depend on backend interfaces on the server side?
(e.g. integration with SAP, dependency on fax or file system, etc. are not compatible with a hosted/cloud environment)
- Which applications use UI elements only supported in the Notes Client?
Transformation
Making your environment a more maintainable and more importantly, shapeable Domino environment facilitates adoption of Verse, Connections, Watson Workspace et al.
Using the above mentioned options you can achieve a better form of control over the platform and allow for integration and expansion with additional systems and services.
AI has a lot to offer when determining the forward path for each application:
- Investigate the best approach to optimize and modernize your application landscape
- Identify unused applications (deletion candidates)
- Identify read-only/read-mostly applications (content migration candidates)
- Identify archiving and sun-setting candidates
- Identify migration candidates for IBM Connections or other content platforms
- Identify most valuable applications from both a usage and complexity standpoint
- Identify potential roadblocks in applications (e.g. applications with a lot of java code)
In situations where the focus is on email Cloud migration it allows you to:
- Analyze databases with migration relevant mail dependencies
- Get insight into deviations from the standard template and identify possible roadblocks or co-existence topics
Licensing & Entitlement
panagenda ApplicationInsights is licensed on a per database instance basis.
For existing IBM customers with valid maintenance for IBM Domino (including IBM Domino Express offerings), a free entitlement license is available to unlock the 50 most used and 50 most complex application database instances together with extensive insights into security, deployment integrity and load patterns for the entire Domino environment.
With the entitlement comes:
- Entitlement to IBM global support
- 12 months usage of the panagenda ApplicationInsights tool from date of release
- Analysis of your entire Domino environment and details on:
- Environment, Inventory and Usage overviews across all database instances
- Usage details for 50 most used database instances
- Design complexity of 50 most complex database instances
- Design insights for 50 database instances across the most used and most complex database instances
Please check IBM Passport Advantage (see {*}https://ibm.co/1OxxqRC*) for information and conditions. Additional packages can be bought per 500 database instances. Please contact your IBM reseller or representative for more information. Details on how many value packs your environment needs can be found on the Unlock more insights page in ApplicationInsights itself.
Which database instances are shown within ApplicationInsights depends: For the entitlement version, the selection is made based on complexity and usage. Once additional value packs have been purchased though, the selection shifts and is made solely on which instances are most heavily used.
Client system requirements
panagenda ApplicationInsights server installation requirements are listed in the technical Setup guide which can be found here: {*}https://www.panagenda.com/download/* ApplicationInsights/ApplicationInsights_SetupGuide_EN.pdf
The panagenda ApplicationInsights web interface is compatible with many HTML5 capable devices and browsers. Recommended browsers are Chrome (64 bit) and Firefox (64 bit).
Browser security and Network Access:
Nospecialwebbrowsersecuritysettingsarerequiredtorunthepanagenda ApplicationInsights web interface.
To access the panagenda ApplicationInsights web interface, you need to have access to the panagenda ApplicationInsights appliance via TCP/IP, port 80 (HTTP) and port 443 (HTTPS).
Data Collection
Data Collection Scope
ApplicationInsights collects data on an ongoing basis about all the databases within your Domino application environment. Data is retrieved from various sources including:
- Domino Console
- Notes.ini
- Log.nsf
- Domlog.nsf
- Catalog.nsf
- Domino directories including directory assistance
- Design data from the analyzed databases themselves
Information is collected for all database instances available on the servers specified during configuration/setup. Which servers are included in the collection process is specified in the Discovery settings of panagenda ApplicationInsights.
The data is stored on the panagenda ApplicationInsights Appliance indefinitely1 to allow for trends and overviews over time.
Instances versus Databases
ApplicationInsights looks at individual instances when collecting data. An instance is defined as a nsf/ntf container living on a server having a replica ID. A Domino application or 'database' is determined by a unique replica id and can be represented by more than one instance (replicas).
1. Depending on the availability of sufficient diskspace.
Why are we collecting info about different instances instead of just one?
By looking at the instances we can give you more granular and detailed information about the application. Like on which servers it exists, which instances are being used by which users and if there are differences in design between replicas (for instance when replication is broken).
It also allows us to indicate differences in design between application instances and problems with replication, the design task, design inheritance settings and duplicate templates that could cause differences in design.
Database / application:
If in this document the term 'database' or in some cases 'application'2 is used it represents a unique database identified as a file with extension .NSF or .NTF and all its analyzed3 instances (replicas) on other servers. Also, if in this document the term 'application' is used in reference to analyzed databases, it refers to databases of both type Mail-In databases and Applications.
Instance:
If the term instance is used a single replica of that database is meant. Note that more than one instance with the same replica ID may exist on any given server.
Definitions
Determination of Database Types & Focus Databases
The appliance automatically categorizes a found NSF/NTF instance into one of the following types of categories:
- User Mail database(identified by a person document pointing to the instance)
- Mail-In database(identified by a non-system mail-in document …)
- System database(identified via well-known file or template name)
- mail.box database(identified from Domino server configuration settings)
- Directory(identified from Domino server configuration/used template)
- The term 'application' is also used to indicate a category type of databases as defined in the topic "Definitions" on[ page 11|#_bookmark12].
- As panagenda ApplicationsInsights only has insights into the instances on servers it is analyzing it is important to ensure all servers are included in your discovery set. For details about this please refer to the technical documentation.
- Orphaned User Mail (user mail files no longer associated with a person document)
- Application databases(all remaining not categorized into cat 1-6)
If a NSF/NTF instance is categorized once on one server, all existing instances with the same replica ID get categorized into the same category. This indication will not change once an instance is scanned for the first time unless things change in the infrastructure, servers are added, the design or ACL is changed, or the calculation algorithm is optimized (for instance with a new release of ApplicationInsights).
Based on the identified types, the DBs are divided into two groups: „Focus Databases" (consisting of Applications and Mail-in Dbs) and „Other Databases" (consisting of the remaining database types).
The majority of detailed usage and design analysis is performed on Focus DBs, but there is a variety of charts and reports with information about the other types.
Additional information outside the scope of ApplicationInights regarding these other DB types and infrastructure topics is available in panagenda iDNA. Please check our website or contact us for additional information.
User access days versus sessions
Each time a user accesses an application a session is set up. During the day users can have multiple sessions, as sessions get closed, users log out/login again or because they use multiple windows or clients. So, one user accessing an application over the day can result in multiple sessions. Sessions can also occur when servers and processes access database instances.
A User Access Day is identified as a unique user accessing an application on any given day within the analyzed period.
So, there could be 20 sessions for User A accessing application Z in a period of 7 days but if that user only accessed the application on day 1 and 5 of that period with 14 sessions occurring on the first day and 6 on the fifth day the User Access Days number will still only be
2. In several graphs this distinction is used to eliminate the risk of skewed numbers and to allow you to make a more balanced decision when it comes to usage numbers.
- Complexity, Design impact, Design similarities and Design Insights Design Complexity is based on the magnitude of design elements and the amount of source code in these elements. The calculation is refined by several considerations like code language type, usage of Reader/Author fields, custom XPages control, etc.
Design Similarity analysis identifies how much alike a database is to all other analyzed databases. Databases with high similarity are grouped into design clusters, which allows for quick identification of replicas that might deviate from a common design. It also provides means to identify 'template candidates' for databases that have no template specified.
Design Insights are combinations of certain patterns occurring in the source code. These combinations are called "Findings" and can be anything from identifying platform dependencies when local DLLs are referenced to understanding if a piece of code interacts with other databases.
Design Impact is a categorization of seven levels from "Insignificant" to "Exceptional" that indicate the impact redesigning or migrating the application would have. The Design impact is calculated from three main sources: Complexity, Insights and Similarity.
Data Collection and Time Constraints (Servers Being Polled/ Period Collected)
AI collects data continuously from the environment and stores it in the virtual appliance's database system. This ensures that the data collected stays available even after server logs have been cleaned up and allows handling and analysis of much larger amounts of data than what would be possible on the Domino platform.
Right after the initial setup of AI, data collection begins and user activity data is collected from that time on. The virtual appliance goes through three steps until the first data is available four days after the initial setup: Usage Collection, Design Complexity analysis and Design Insights analysis. Once at least a part of the Focus DBs have gone through all stages, the AI interface becomes available. Until then, a status overview screen will provide information about the current collection stage of the appliance.
In the AI web interface, a small progress and status indicator on the top right of the content area provides information about the current status.
To avoid spiky load on collected servers, the AI appliance spreads out collection over the day. Usage data has to be collected on a continuous basis though, so constant activity of the Notes ID used by AI is to be expected.
Why don't I see all info?/Why is part of the graph greyed out?
Much of what is displayed in AIs reports and charts is determined by the installed license key. The IBM Entitlement license key will effectively provide various information on somewhere between 50 and 100 database instances (see "Licensing & Entitlement" on page 8 for details).
Certain graphs and reports will show data for all database instances regardless of the license key, but certain details might be omitted. Other elements will not show unlicensed content at all.
Please refer to "Licensing & Entitlement" on page 8 to see how your organization can obtain additional licenses.
Status is telling me Analysis failed on several databases. What do I do?
When analysis fails on a database, multiple causes can be the reason. Most common reasons are:
- The AI appliance cannot reach the server where the database resides (network issues)
- The ID used in AI does not have enough access rights to access the server where the database resides
- The ID used in AI does not have enough access rights to access the database
- The database has hidden design (often with third party tools)
Verify and correct if possible the above and then rerun the failed databases as follows:
- Click in the right upper corner on the "Status" indicator or click the little cog wheel icon in the right upper corner and select "Design analysis Status". This will open a view called "Collection Status".
In the view all analyzed database will be listed with their analysis status (column: Design Collection). Click on the "Design Collection" column to sort it and see all that have failed.
- Check the failed databases for accessibility as described above
- Use the option in the top of the view called "Rescan databases" to perform a rescan of the failed databases, all databases or filter the view down to one or more specific databases and choose "filtered databases" to run it on a subset only.
 Note: Rescanning databases is a multistep process, that will take up to 2 days before the newly rescanned databases will appear in the interface. Do not rescan all databases unless absolutely necessary as it may run over several days and put significant strain on the appliance and infrastructure.
Getting Started with ApplicationInsights
The following section gives info on the most common operations within panagenda ApplicationInsights.
Login
Access to panagenda ApplicationInsights is on a per user basis. It requires a username and password to login.
Keep in mind that both username and password are case sensitive!
User accounts can be created by the administrator. Please refer to the technical documentation for information on how to reset passwords and create user accounts.
User Roles
panagenda ApplicationInsights has two types of users:
- Viewer: Can access all analysis and metrics data and interact with the visualizations but is restricted from changing panagenda ApplicationInsights system settings.
- Administrator: Can access all analysis and metrics data and interact with the visualizations and is allowed to manage panagenda ApplicationInsights system settings. Including creating accounts and resetting user passwords.
System Settings
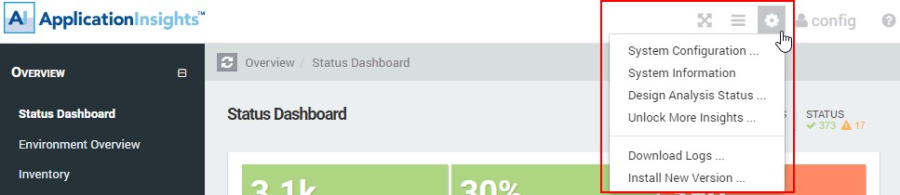 System settings are only available to users with the "Administrator" role and consists of several items accessible through the menu in the top right corner of panagenda ApplicationInsights ('cog wheel' symbol).
Figure 1: System Settings
- System configuration: Links back to the system configuration menu. Please refer to the technical documentation for further details.
- System Information: Provides information about the version of AI, the server (Virtual Appliance) it is running on, the browser currently being used to access panagenda ApplicationInsights and the cache. This information can also be requested of you by support in case of problems.
- Design Collection Status: Detailed information on design collection status per database instance and the option to rescan failed databases.
- Unlocking More Insights: How to obtain additional AI Value Packs.
- Download logs: Link to the administration section to download logs.
- Install New Version: Links to the administration section where upgrades can be installed.
Using panagenda ApplicationInsights: Interface Tips
The various graphs and visualizations within panagenda ApplicationInsights allow you to easily focus in on certain interest areas and data subset. For this several features exist to help you interact with the graphs.
Selecting/Deselecting subsets
 Pie charts, bar charts, line graphs and bubble charts that show you multiple categories often allow you to select/deselect certain categories to focus in on subset. To do so, simply click on the category in the charts legend.
Figure 2: Subset Selection
Certain Bubble charts allow you to focus in on part of the graph by using the mouse to select the top left most grid point of the area you would like to focus in on, holding the right mouse button down and drawing it to the bottom right grid point you would like to focus in on. Releasing the mouse there. This will concentrate the graph in on the selected area.
Example views where this is used: Usage - Sessions vs Complexity, Usage – Web vs. Client Usage, Usage – Notes Client Usage, etc.
Maximize screen usage
 Hide left menu: To maximize screen width on a graph or page it is possible to hide the left- hand menu of panagenda ApplicationInsights. To do so click the so called 'hamburger' icon in the top right corner.
Figure 3: Collapsed Menu
To return the menu simply click the same icon again.
Help and additional information
Certain elements in the panagenda ApplicationInsights interface have Help text associated with them to explain the specific graph or element.
Underlined: An underlined (dashed line) element usually indicates that on mouse over a help text or additional information is available.
"?" Symbol in right corner next to graphs: Indicates that there is a help text available that will be visible on mouse over.

Figure 4: Help Symbol
Details: Some graphs will allow you to mouse over or click on a node or data point to access more data. To go to the instance details page for any given database in any of the bubble charts for instance, simply double click on the bubble.
AI Components
This chapter focuses in on the individual graphs and overviews panagenda ApplicationInsights offers you.
Overview
The overview section of panagenda ApplicationInsights gives you a quick overview of your complete application environment and the status of data collection.
Status Dashboard
The status Dashboard gives you a first glance of the usage and design insights status:
- # DB Instances Discovered: The rounded number of database instances (individual database replicas) discovered on the servers being polled.
 Note: If not all servers in the environment are included in the collection this number might be skewed. For accurate information, it is important to include at least all servers that might hold applications or mail-in databases but preferably all servers for proper visualizations across the entire Domino environment
- % Databases Used in Last 90 Days: The percentage of database instances (out of the discovered instances) accessed by users in the last 90 days
- # Focus DBs Identified: The number of database instances identified as either a type "Mail-In" database or type "Application". Other databases are: user, server & orphaned mailboxes, system databases and Directories.
- % Focus DBs Used in Last 90 Days: The percentage of focus database instances (out of the discovered instances) accessed by users in the last 90 days
- % Focus DB Instances Unlocked: Percentage of database instances considered "Focus databases" that are covered for analysis by your license agreement
- # Focus DBs Designs Collected and Analyzed: The number of Focus databases for which design analysis was successfully performed. If this number is lower than the number of Focus DBs identified this could indicate that not all databases could be analyzed.
- % Focus DBs with Design Insights in Source Code: Percentage of the database instances analyzed for which design Insights were found. Design insights consist of "Findings" of specific code elements or combinations of code elements, based on predetermined rulesets.
- # Users Registered: Total number of users registered in the Domino environment (taken from your Directory infrastructure)
- # Users Active in Last 90 Days: Number of users who have shown activity in the Domino environment over the last 90 days.
User Activity Last 90 Days: Shows you the activity generated for focus versus non-focus databases based on the "user access days". A user access day is the equivalent of a user accessing the database on a given day. By using days instead of sessions, it prevents sudden spikes of activity skewing the data. This graph gives you insights into which types of databases most of your users are working in (focus versus non-focus databases) and how they are accessing the databases (web versus client).
Usage history: Each column in this chart represents the total number of database instances which were accessed in the particular time frame. A database instance that was accessed in the last 7 days will thus also show up in all other 'used' columns. This graph will of course get more meaningful over time as it will start to highlight how many are still in daily use and how many are silently falling into disuse.
Design Impact: Indicates how the focus databases (databases of type Applications or Mail-In databases) are categorized in terms of design complexity. Design complexity depends on many factors which will be further explained in "Design Complexity" on page 41.
Environment Overview
The Environment overview provides you with a single overview of how the infrastructure of your Domino Environment is set up.
It lists information about the number of:
- Directories
- Servers
- Servers analyzed (by panagenda ApplicationInsights)
- Number of Domino Releases (utilized by the servers)
- Number of Operating Servers (utilized by the servers)
- Registered Users
- Active Users
- Groups
- Group members
- ACL entries
- Databases deployed (focus & non-focus databases)
- Database storage used
- Databases touched by active users
- Views
- Views indexed
- View storage
Inventory
The Inventory page will give you a global overview over the total number of database instances, and replica sets you have.
By comparing these numbers against usage information and disk space used you get a better insight into the actual capacity utilized by your Domino environment.
Catalog
The Catalog section of panagenda ApplicationInsights is where you can get deep dive information about a specific database instance. Both in terms of usage as well as design.
Working with the Catalog List
Instances listed:
 The catalog list lists all instances your license entitles you to access for analysis and allows you to easily filter, search, export and compare information for the analyzed databases. Please review the paragraph on licensing to understand how the selection of instances you see is made. As this list displays instances, it is possible that you see several instances of the same replica set.
Figure 5: Instances listed
Displayed number of lines:
The "Show entries" option in the top left allows you to show more or less values per page.
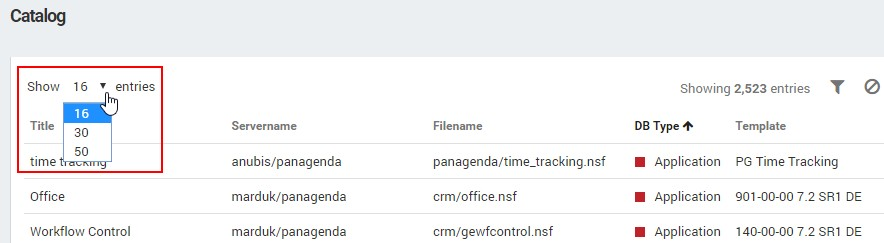
Figure 6: Show x entities
Displayed columns:
The "Columns" option in the top right allows you to select one of the column sets. The "Default" set contains information like the location, the type of instance and the impact score.
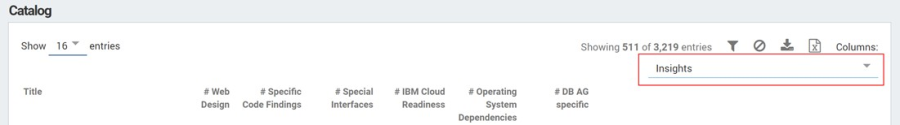
Figure 7: Displayed Columns
The "Usage" set show information about the number of sessions and the types of access (mobile, web or Notes client) as well as some design information.
The "Scores" set shows you, among others, information about ranking and scores for complexity, insights and impact.
The "View Characteristics" set shows information about number of views, used views and code used in views.
The "Code Languages" set shows info about used types of code in code elements.
The "Core Design Elements" set shows Number and types of design elements that contain code.
The "Insights" sets give you specific filter options to select databases with similar ruleset findings.
The "Insights <ruleset>" views give you the option to see all findings for each of the rulesets (including self-created ones) in a table list for export and analysis.
Sorting & filtering:
To find a specific instance you can sort the list on various elements. For example, on the name of the database, the server the instance is located on, or even on a type or impact score if you are interested in finding databases of a specific type or complexity. To sort simply click on the column header.
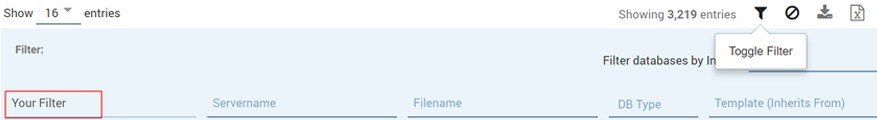 Alternatively, you can also filter the list on any of the columns by clicking the "funnel" icon in the top. The column headers will then become fields where you can enter the search term or value you want to filter on.
Figure 8: Sorting & Filtering 1
To clear a set filter use the "stop sign" icon next to the funnel icon.
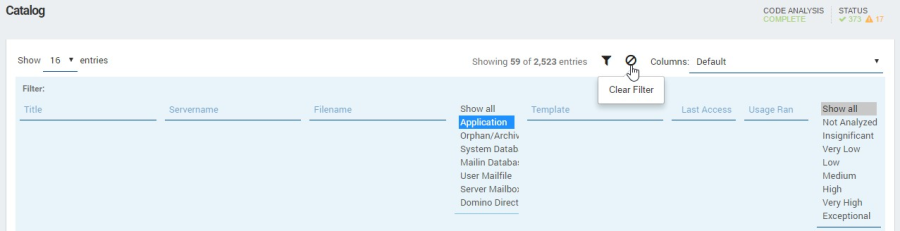
Figure 9: Sorting & Filtering 2
 NB: Keep in mind that if you switch between column sets after filtering the filtering is maintained. Use the icon next to the Funnel icon to clear a filter and return to the full result set.
Filter by Insights:
When opening the Filter options an additional option becomes available to filter databases by Insight. This allows you to make selections based on what type of designs you want to review or to easily export a list of databases containing a certain type of finding.
To clear the filter by insight filter simply click on the little X behind the filter selection.
Exporting data:
The two icons next to the Funnel & Clear filter icons allow you to export the filtered data set as either a CSV or EXCEL file. All columns for the filtered databases will be exported.

Figure 10: Export Data
Opening a database instances details:
To open the details of any instance simply click on the table row for the instance you are interested in.
Instance Details - General
On opening the database instance details, you will be presented with a header that contains general information about this specific instance. Keep in mind that if a database has multiple instance in its replica set each of them will be analyzed separately and classified separately. This is done deliberately to ensure that you get the most accurate information.
A database might for instance have replicas on three servers but all usage might only be taking place on one server. Also, due to replication restrictions or problems, it is possible that the design on databases sharing the same replica id is not the same.
Therefore, the usage, design and ranking information portrayed in the top is all instance based.
- Instance Details - Tab Application
The Application tab is divided into three sub tabs (left side)
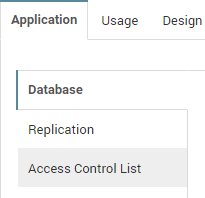
Figure 11: Application Tabs
Database:
Displays general information about the database instance as taken from the database properties, the size of the database instance, the template it inherits from (or is), whether it is listed in the Domino catalog and whether it is included in MultiDB indexing.
Replication:
Indicates whether replication is enabled and which settings have been activated
Access Control List:
Gives information about how many entries there are in the ACL with a specific level of access and which level of access special user entries like "Default" and "Anonymous" have.
- Instance Details – Tab Other Instances

- Instance Details – Tab Other Instances
This tab is only visible if other database instances have been identified that share the same replica id. If there is no tab for instances then no other replicas were found on the analyzed servers. The value between brackets behind the tab name indicates how many other instances share the same replica id.
Each instance will be identified with its own tab showing that instances "Application" details and a button to open the full analysis details for that instance.
Keep in mind that multiple instances with the same replica id can exist on one server.
Views
The Views tab shows information about the number of views an instance has, their size and usage. It has two tabs. One that holds general overview info like usage and number and type of code blocks/lines while the second tab lists all the views in the database with their
individual settings, size, code elements and when they were last accessed. This information can help you determine which views are actively being used or not and which views are perhaps taking up unnecessary space in your database.
Additional columns can be made visible by clicking the + icon above the column categories:
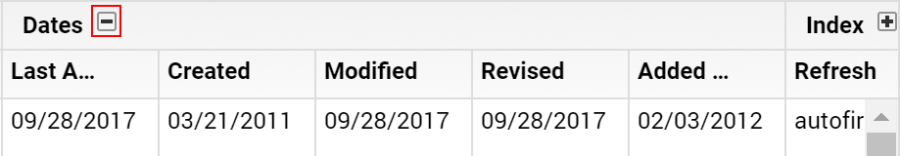
Figure 12: Views Tab - Additional Columns
Instance Details – Tab Usage
The Usage tab gives you specific information about how the database instance is being used and by whom (departments). The Usage tab has three sub tabs that show specific information. The user activity tab shows you the number of sessions and the Active Users per period in the instance, split out to Web and Client activity.
The second tab splits out the Session data to read/write activity as well as giving you the amount of data being uploaded/downloaded. Making it possible to get a more in-depth view into how the application is being used and for what purposes.
The third tab (if activated in your organization) shows information about the usage per department. Showing the various departments that use the database, their usage specifics (like number of users, Access days and download/upload activity.
The Department Tree allows you to sort either alphabetically (by department name) or by most active (Session Count):
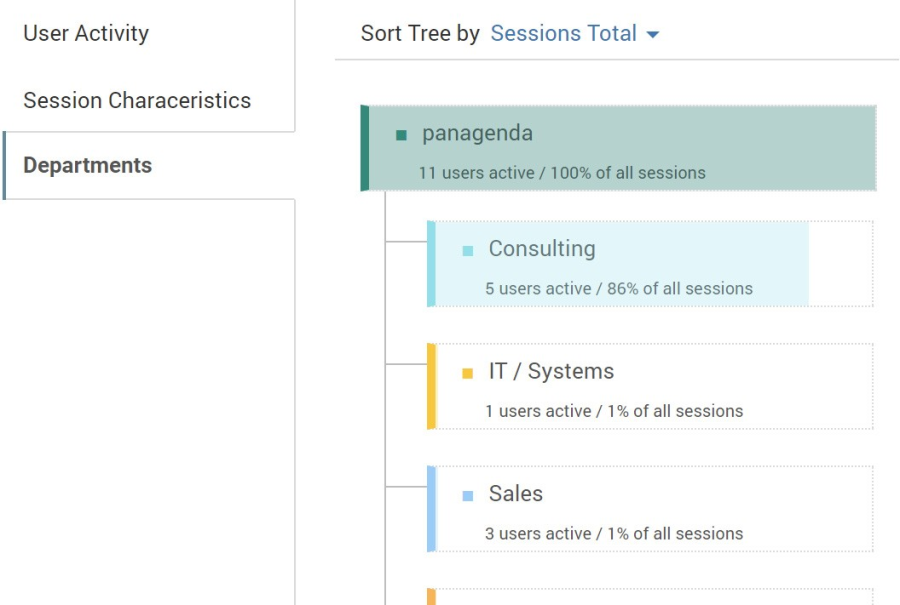
Figure 13: Usage Tab - Department Tree
 Each department tab shows you the number of users active in the instance from that department and the percentage of sessions generated by them. To drill down into sub departments, click on the departments themselves which will open (if available) the next level of departments as well as an overview for that departments usage details. These include information like when the instance was last accessed over the web, number of sessions upload/download details. By clicking the "User List" tab in the top you can even get a list of users accessing the database from that department in the given period with the date they last accessed it and the session and upload/download characteristics of each user.
Figure 14: Usage Tab - User List
 Note: Organization information is taken by default from the contents of the department field in the person document for each user in the Domino Name & Addressbook. Your administrator can deactivate this or change the collection process to collect from a different source. Please refer to the Setup Guide for details on how to do this.
Having these detailed insights into the usage of the instance can help you determine various things. Like which department and or user would perhaps be a logical choice to 'own' an application (in case no business owners are known), whether a specific instance needs to remain as a separate replica or could be consolidated / removed and what the impact to specific departments would be of changing / removing an application.
- Instance Details – Tab Design Complexity
This tab is only visible if a design analysis was performed on the database and if it is in scope.
The design complexity tab gives insight into the design elements of the database. Giving you the totals for each type of element being used, how many of them contain code – and what type of code as well subsidiary elements like fields, subforms, etc. are being used. Additional information is given in the sub tabs per design element type that can be clicked on the left side.
LOC stands for Lines of Code | Ø for average | # for number
- Instance Details – Tab Design Similarity
The Design Similarity tab is where you will be able to identify databases with near similar designs. Regardless of whether they share a template or not.
If an instance belongs to a similarity cluster (meaning it shares a design that is for 95% or more similar to that of other instances in the environment) this tab will appear.
On the Similarity tab each node in the diagram represents a sub-cluster consisting of 1 or more instances which share the exact same design. The top node represents the design held by the instance whose details you are currently reviewing. The other nodes represent sets of instances with near similar designs.
In the right-hand side pane, the system will show you suggestions for the most likely Template candidates (if available) and how many instances are already referencing them.
 By clicking on an individual node, you get to see additional info about the instances sharing that design. Like the names and templates each instance inherits its design from (if applicable). By holding the CTRL key and selecting multiple nodes you can then identify which other database are sharing a near similar design and could potentially be candidates for template consolidation.
Figure 15: Design Similarity
To open one of the near similar design databases, simply click on the title in the details pane on the right.
- Instance Details – Tab Design Insights
This tab is only visible if a design analysis was performed on the database, if design findings were found and if it is in scope. In all other cases the tab will not be visible
This tab is where panagenda ApplicationInsights helps you identify potential problems and challenges in the code of your database instance design.
Based on a predetermined list of criteria (rulesets) panagenda ApplicationInsights identifies certain occurrences or combinations of occurrences in your code that could require attention in case of optimization, modernization, transformation or migration.
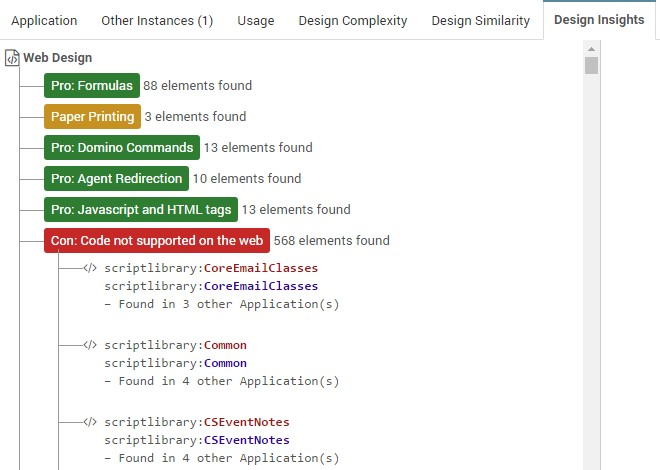
Findings:
Findings are categorized into ruleset categories like:
- Web Design
- Mail Dependencies
- Special Interfaces
- Operating System Dependencies
- Dependencies On Other Databases
- Specific Code Findings
- Additional custom rulesets you define
Each ruleset can be opened (double click) and will list the type of findings in that category and the number of occurrences in the code. Each finding criteria has a weight that help identify the potential risk of the finding. This is indicated by the color of the finding label.
 Findings classified as more high risk/more complex are shown as red while less important findings would be indicated with green.
Figure 16: Specific Code Findings
 Each finding category can be opened to review the individual code snippets and their location.
Figure 17: Web Design
Each finding lists the design element type, design element name and the action in which the code is located. It also lists in how many other applications that code element can be found.
Not only does panagenda AI give you the indication of what code elements could be problematic, it also tells you in how many other applications the same code is being used. Allowing you to plan more efficiently and replace code across your platform as you go.
To view the affected code simply click on the element block. The code will appear in the right hand window.
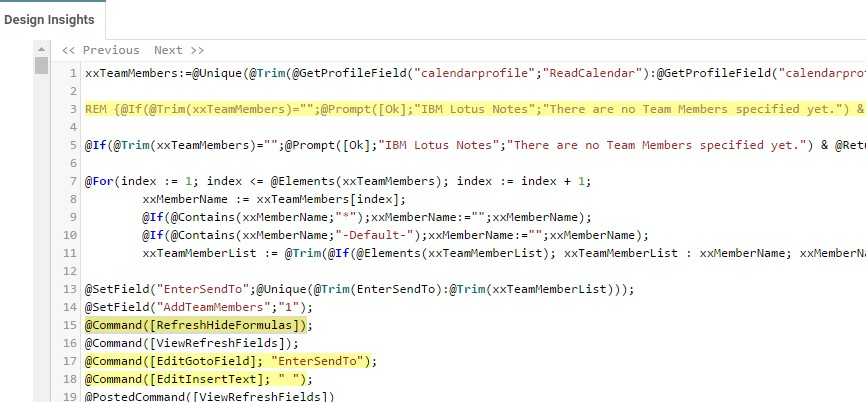 The affected code lines are highlighted in yellow and their location is visible in the right scroll bar for easy navigation. Use the "<< previous" and "next >>" buttons in the top of the code window to easily navigate tot the affected code lines.
Figure 18: Affected Code Lines
Use the "Open in Designer" button in the right upper corner to open the specific design element in the Notes Designer client directly. This does require that the Notes Designer client is installed and that you have access as a Designer to the specific database. For the "notesdesigner://" links that this button uses to work you will also need to install the panagenda Application Designer Helper as well. To download and install this please refer to: {*}https://www.panagenda.com/2017/10/open-in-designer/*
Usage
The Usage section provides insights into the clients used by users to access the various database types. These overviews will help you determine which databases are predominantly used in the IBM Notes client and which predominantly through web browsers.
By linking the type of client used to details about the actual usage and number of users accessing that database, panagenda ApplicationInsights allows you to prioritize and determine importance and business value of each database.
Sessions versus Complexity
The Sessions versus complexity view allows you to see which of your focus databases instances with a high complexity are also often accessed. Each bubble represents a single database instance. The size of the bubble indicates how many unique users accessed the database over the analyzed period. In the details window that becomes visible on moving the mouse over the bubbles you find additional info on the type of clients and the "Access days" (see "Definitions" on page 11). To see full catalog details on the specific database instance simply double click the bubble to go to the instance details.
The closer a bubble is to the top of the scale, the higher the complexity score. The more to the right a bubble is the higher the amount of sessions. Database instances to the left bottom corner are in general easier targets for archiving as they are less frequently used and less complex. The same goes for smaller bubbles which indicates less users are involved.
Grayed out bubbles indicate databases out of scope of the license key obtained by your organization.
Web versus Client Usage
In this overview, all databases that show activity are represented as bubbles. The graph uses various elements that help you identify information about the databases in terms of number of users, type of access and activity.
Positioning on the graph:
The top dashed line represents pure web access, meaning that the databases closer to the top are predominantly or exclusively accessed through browsers.
The bottom dashed line represents pure IBM Notes client access. Meaning that the databases are predominantly or exclusively accessed through IBM Notes Clients ("rich" clients).
'Mixed access' indicates those databases that are accessed through both rich clients as well as browsers.
The horizontal position of the bubble indicates the number of sessions (web & client) generated by users accessing the application. The further to the right a database is the more activity a database has had.
Color & Size of the bubbles:
Each bubble represents a database instance.
The size of the bubble indicates the number of unique users having accessed that database in the period analyzed.
The color indicates the type of database. The legend in the bottom explains which color represents which database type. Click on a type in the legend to remove that type from the graph to focus on for instance just applications.
Hover over / details:
To see the details for any specific database simply hover over the bubble. Note that for non- licensed instances, less info is displayed or info is obfuscated. To see full details simply double click the bubble.
The details popup shows:
- Name, location and replica id of the database
- Complexity score or "-" if no score is awarded.
- Number read/download versus write/upload actions in the analyzed period
- Number of sessions (used for the vertical and horizontal position on the graph).
- Number of unique users (used for the size of the bubbles)
- User Access Days per type of session
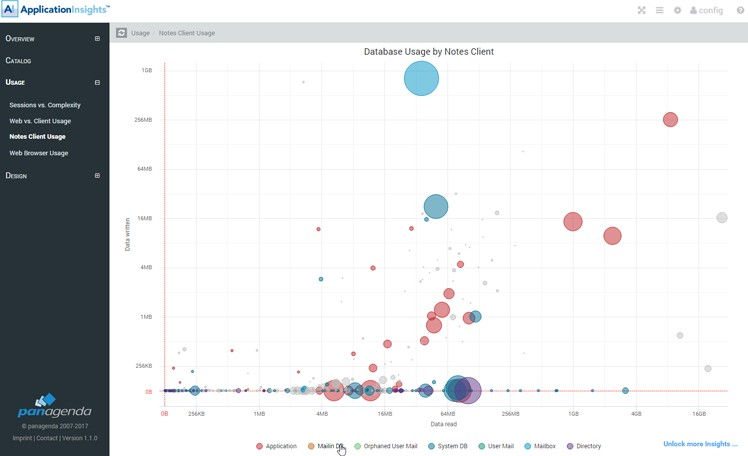
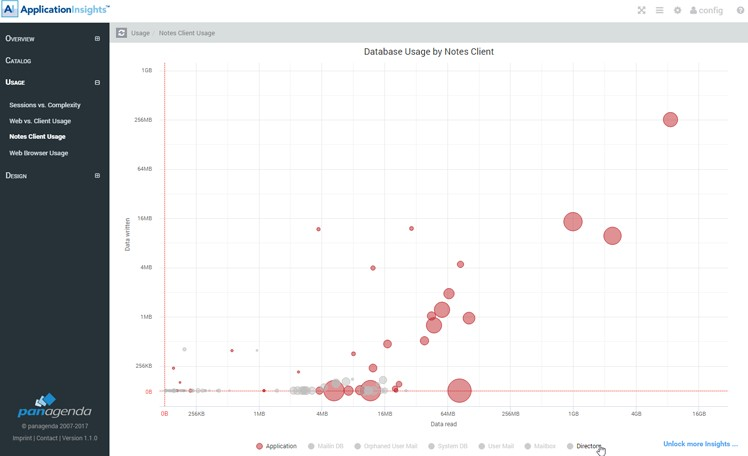
Notes Client Usage
On the Notes client usage tab, you can see the type of activity being performed on databases accessed through the IBM Notes client.
As in the previous graph the size and color of a bubble indicate the type and number of users accessing the database. The horizontal position indicates the amount of data traffic caused by READ operations performed on this database and the vertical position the amount of data traffic caused by WRITE actions.
The more a bubble is towards the left bottom corner of the graph the less used it is in rich clients. Similarly, the more towards the right upper corner the more actively used the database is on rich clients. Whereby the size of the bubble indicates the number of unique users performing these actions.
 Note: A database showing as having little to no activity in this view does not necessarily mean it is not being used. It could be that it is predominantly used through web clients, for instance.
Web Browser Usage
Displays data uploaded (WRITE operations) versus date downloaded (READ) operations for databases accessed through web browsers. See "Notes Client Usage" on page 34 for information on how to use this view.
Design
The Design section of panagenda ApplicationInsights gives you global information about the design complexity and details of your application landscape.
Complexity
The Complexity page lists the overall totals of all analyzed designs in your application landscape when it comes to focus databases.
- Number of focus databases analyzed
- Total number of lines of code – use the mouse-over to see a breakdown in terms of used coding language
- Average complexity index
- Highest complexity index
The average & highest complexity index give you an idea of the spread of complexity. By looking at the efforts and costs of transformation or modernization of a low complexity, an average complexity and a high complexity database you can get an impression of time and effort needed to perform the actions you can give yourself a starting point to do calculations for planning and investment. Combining this with other information (like usage) allows you to extrapolate that over your entire environment.
Additionally, this page gives you insights into the prevalence of the various coding languages used, the number of design elements and the number of code lines represented by those design elements.
At the bottom of the page you see a distribution overview of all databases with a complexity index of High, Very High or Exceptional.
Similarity
The Similarity tab is where you will be able to identify database that share a design but not necessarily a template, or designs and/or templates that are so similar that it could be beneficial for optimization and modernization to consolidate them into one single template.
To do so, panagenda ApplicationInsights analyzes the designs of each of your focus databases and compares them. Both on design elements as well as on individual code line
level. Databases that share at least 95% or more similarity with each other are then grouped into 'similarity groups'. Independently of whether they share a design template or not.
Overall Similarity insights:
The top bar of the Similarity page shows indicators for the number of database instances that can be found in clusters >1 member, >10 Members or >100 members. Where a cluster is a group of database instances that share a >95% similarity to each other. A first indicator of the potential impact of template consolidation.
Similarity Cluster distribution:
Below that a graph will show you the various identified similarity clusters (the number of clusters is listed above). Larger bubbles represent larger clusters (more database instances sharing the same similarity) and smaller bubbles represent situations where only two or a few database instances are involved.
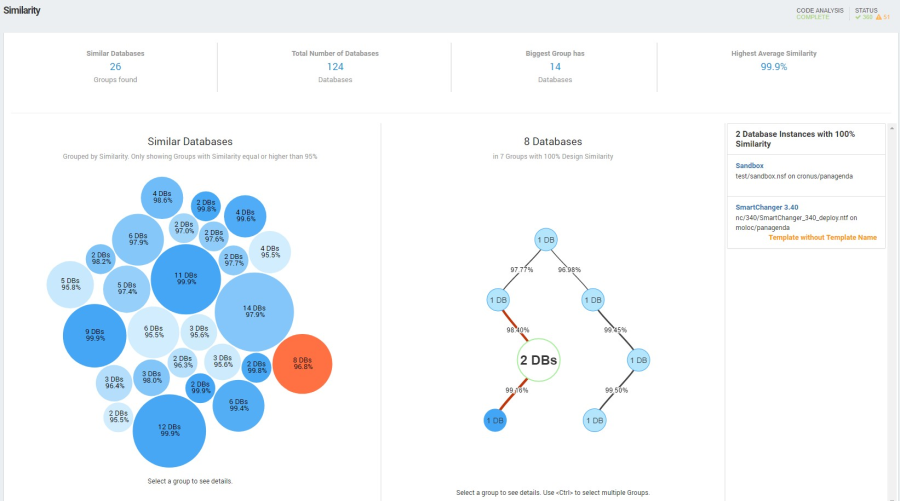 The bubble color is determined by the average similarity score inside a cluster. The higher the similarity the darker the bubble. The exact percentage is also displayed as text if bubble size allows.
Figure 19: Design Similarity
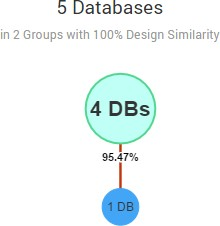
Similarity Cluster details:
By clicking on a cluster bubble a second column will appear holding a node diagram representing that cluster's structure. Each node in this diagram represents a sub-cluster of 1-n database instances that share a unique design with 100% similarity score, with the size and
number on the node representing how many instances share that same unique design. Links between nodes show the percentage of design similarity between sub clusters.
In the third panel on the right-hand side potential Template candidates are shown for the whole cluster, including the number of databases already inheriting from this template.
Instance and template identification:
To get more information about the database instances represented in each node, simply click on a node. The third column of information will then show a list of instances represented by the selected node. For each instance the title, location and template name are shown so that you can quickly identify if these instances indeed inherit from a shared design or perhaps should do so.
You can select more than one node at a time by holding the CTRL key on your keyboard. To see an individual instances full details and design insights simply click on its title in the third column.
By using this page, you should be able to quickly identify which database designs within your environment can be consolidated and optimized, which databases should be assigned to a template and what the impact will be when performing template consolidation.
Insights
The Insights page gives you information about the designs found containing insights ("Findings") based on the rulesets. Here too you see information about the number of lines of code (and on mouse-over their distribution across various coding languages) but you also see the number of databases that have findings and information about the total number of findings found.
A finding is where a specific code element or combination of code elements was found that is listed as something that requires consideration in case of for instance modernization. Think of things like dependencies on other databases, operating system or rich client but also old code, code not supported on the web and mail dependencies.
These findings are categorized into the following rulesets:
- Web Design
- Mail Dependencies
- Special Interfaces
- Operating System Dependencies
- Dependencies On Other Databases
- Specific Code Findings
- Custom rulesets as defined by your own organization
All these various categories of findings are then listed in the "Design Insights – by Ruleset and Findings" graph. To focus in on a certain ruleset simply click on it to expand it for better overview. To collapse it back to the overview simply click on the button in the right upper corner.

Figure 20: Design Insights Ruleset
The color of each finding indicates its relative impact (Dark red being severe and green being low).
The distribution of the different ruleset categories as well as the findings within them give you an insight into the type of potential roadblocks or focus areas in case of design changes you might face. To see which databases are within each ruleset use the Catalog view and sort them based on the various "Insights" column sets.
Custom Insights
The Custom Insights section is visible only to those authorized for its use and allows you to see how the provided Insights are build up as well as provide options to create new, organization specific insights.
Manage
![]() The manage section contains an overview of all Rulesets, Insights and Patterns that are available in your ApplicationInsights environment. These can be both system insights provided with the tool (identifiable by the panagenda icon behind the name) as well as custom elements created by your own organization. You can hide the panagenda items and focus in on custom elements by simply clicking the icon behind the search field:
The manage section contains an overview of all Rulesets, Insights and Patterns that are available in your ApplicationInsights environment. These can be both system insights provided with the tool (identifiable by the panagenda icon behind the name) as well as custom elements created by your own organization. You can hide the panagenda items and focus in on custom elements by simply clicking the icon behind the search field:
Figure 21: Custom Insights - Hide panagenda Items
The view is divided into three tabs holding:
Tab Rulesets: Design insights consist of a structure that groups them into logical sets. So called rulesets. This tab shows all available rulesets and whether or not they are enabled. Rulesets help identify the sort of insights and give you ways to navigate the findings as rulesets show up in the catalog column sets and on the Design Insights page. The color indicator before each ruleset indicates if it is enabled or disabled at that moment. Meaning that it is included in the design analysis or not. By clicking on a ruleset you get to see the assigned Insights and their severity levels (indicated by the colored bar in front of it).
Tab Insights: Each ruleset contains one or more insights. This tab lists all Insights and below them the rulesets these Insights are associated with.
An insight is a simple search key or a collection of blocks of patterns to be matched. Each Insight can consist of one or many blocks. All patterns inside one block have an 'OR' relationship to each other. Meaning that if any of the patterns in that block is matched the result of that block results in a TRUE value for the database that pattern was found in. If an insight has multiple blocks the relationship between the blocks of patterns is that of an 'AND' relation. Meaning that if all blocks result in a TRUE value the insight returns a value of TRUE and the database is listed as having that design insight.
Tab Patterns: This tab shows the patterns. Otherwise known as advanced insights that make up a single insight element. Each individual pattern can be linked to more than one Insight which are portrayed below the pattern when clicked on. A pattern is a search string that is fired on the collective set of database designs and returns any code elements that match the search string. The format of a pattern can be in either plain text or in the form of a regex expression4.
To understand how custom insights work and how to create new ones please refer to "Building your own Custom Insights" on page 44 on building your own custom Insights.
Code Search
The code Search tab allows you to quickly do ad-hoc searches across all your analyzed database instance designs for specific code or to test search queries you would like to use as Insight patterns. Searches can be entered either as free text, whole word or regular expressions.
The results are shown below the search field whereby each unique code element is shown separately. The number in front of each code element indicates how often the code element is being used.
 Note that a code element can be in a database multiple times.
By clicking on the code element, the actual code becomes visible for review. The search key findings are highlighted to make it easier to identify the exact location. In the details panel on the right hand side the top 25 databases are listed that contain this code element with their location, the design element / field holding the code and the number of elements in that database with this exact code. Additionally export options are available in the top to export the full list of database instances and locations to an EXCEL or CSV file.
If you have the panagenda Application Launcher5 installed you can also click the design element to open it directly in the Notes Designer.
- A regular expression is a special text string for describing a search pattern. More information about Regex can be found on the internet
- Information about the application launcher can be found here: https://www.panagenda.com/2017/10/open-in- designer/
Design Complexity
panagenda ApplicationInsights defines the design complexity of a database on several factors and criteria. The idea being that it should help you determine how to best address topics like modernization and migration.
By combining the design complexity with the actual application usage, a strategy can be determined that is realistic and cost effective.
Collected Design Data
panagenda ApplicationInsights analyses a database design based on:
- Design elements: Identified as Domino design elements like forms, views, agents, script libraries, actions, fields, etc.
- Code blocks: A code block is a set of code lines that together form a logical code element. Like for instance the formula code of an action within a form.
- Code lines: Individual lines of code
For each of these elements various information is collected and analyzed. Like for instance the design element type, the code language, the root element and relative path of the analyzed element and the actual code itself.
By doing so panagenda ApplicationInsights can give you deep dive information about complexity and similarity of database designs.
Design Complexity and Impact Criteria
Based on the collected data panagenda ApplicationInsights uses a wide range of criteria to determine design complexity and impact.
Factors that for instance can influence the complexity and impact are:
- Type and number of specific design elements occurring in the application design
- Specific combinations of design elements occurring in the application design
- Hardcoded references (for instance hard coded server names, etc.)
- Number of code blocks and code lines in the application
- Domino/Notes client dependencies
- Calls to local systems (for instance code that references a user's local hard disk or accesses specific files stored on the server)
- Occurrence of specific code elements that can cause potential migration/modernization challenges
- Occurrences of Author/Reader fields
- SMTP / mail / fax / etc. references that indicate a dependency on a specific system or server
- Third party software dependencies
- Encryption dependencies
- Mail dependencies
- Occurrences of specific code functions and snippets or combinations of such code functions and snippets.
- Etc. etc.
 Note: Custom Insights build by your own organization are not considered while computing Design complexity and impact scores. Deactivating one or more of the standard provided rulesets (identifiable in the Manage section by the panagenda logo behind them) can impact the complexity and impact scores. It is recommended not to do this.
Weighted analysis
An important part of the design analysis is that criteria are not just analyzed on their own but also used in combination with others. Meaning that the design analysis is based on weighted criteria, not just individual elements. What does this mean? Well let's say an application sends out a mail when a user performs a certain action. In the code this is identified by, for example, a formula like @mailsend. However, if that mail is also encrypted in the same code block
before being send out the complexity is much higher as this means that it hits at least three different criteria:
- It uses mail functionality
- It uses encryption
- It has a Notes client dependency (for the encryption to work)
The total weighted complexity of the combination of all three is higher than the sum of each individual element would be and therefore panagenda ApplicationInsights will give it a higher complexity rating.
Design Complexity Ruleset
To be able to give insight into the complexity of an application, weighted rulesets are defined for panagenda ApplicationInsights. These are based on our experience with analyzing database designs for modernization.
The following six rulesets are provided:
- Web_design
- Mail dependencies
- Special Interfaces
- Operating System Dependencies
- Dependencies on other databases
- Specific code findings
If your organization requires additional custom rulesets, you can create your own through the Custom Insights section. See "Building your own Custom Insights" on page 44 on details how to use this.
Building your own Custom Insights
ApplicationInsights comes with a complete and fully defined set of design rulesets, insights and patterns that give you a good overview of design issues and challenges to take into account while modernizing or transforming applications. Still, most organization will have additional or specific things they would like to search for. Therefore, ApplicationInsights comes with an option to define your own custom Design Insights. This can be done on the Custom Insights – Manage page.
Please also refer to "Custom Insights" on page 39 to understand how the interface of the "Custom Insights - Manage" section works.
Structure & definition
Ruleset: Design insights consist of a structure that groups them into logical sets. So called rulesets. Rulesets help identify the sort of insights and give you ways to navigate the findings as rulesets show up in the catalog column sets and on the Design Insights page.
Insight: Each ruleset contains one or more insights. Each Insight can consist of either a single search pattern or one or many blocks of advanced patterns. All patterns inside one block have an 'OR' relationship to each other. Meaning that if any of the patterns in that block is matched the result of that block results in a TRUE value for the database that pattern was found in. If an insight has multiple blocks the relationship between the blocks of patterns is that of an 'AND' relation. Meaning that if all blocks result in a TRUE value the insight returns a value of TRUE and the database is listed as having that design insight.
Pattern: A pattern is a search string that is fired on the collective set of database designs and returns any code elements that match the search string. The format of a pattern can be in either plain text or in the form of a regex expression6.
 Keep in mind that newly added patterns, insights and rulesets will not be evaluated until the next evening run which typically starts at 18:30 (depending on your ApplicationInsights server's locale). Please allow for at least one night for results to show up.
- A regular expression is a special text string for describing a search pattern. More information about Regex can be found on the internet
Creating a Pattern
To create a design pattern, you first need to have the search string or regular expression you want to test for. You can use the Code Search to build and test a pattern and check whether it returns the results you would expect.
After knowing what pattern to search for open the Design Insights – Manage view and switch to the "Patterns" tab in the left column. All patterns are listed here.
To create a new one:
- Enter a name for your new pattern in the top search field and make sure the name isn't already in use (to prevent confusion). Use descriptive names as it will make it easier to identify it later in the process.
- Below the search value where you've entered the name a button will appear called "+ CLICK TO CREATE PATTERN". Click this to create the new pattern. The new pattern is created and added to the list.
- Enter details in the meta data fields for the pattern like an authors name, tags and a description to make it clear what the pattern is about.
- Enter the search pattern in the Pattern field. You can use the "Test" button behind this field to see quickly what would be returned but keep in mind that this test option is more limited than the Code Search view which will also give you information about the databases in which the results are found and links to those database design elements.
- Use the 'save changes' button to save your new pattern.
Instead of creating a new one you can also duplicate an existing pattern by using the duplicate option behind the existing patterns name. This will create a copy that you can then edit to extend or change.
![]()
Figure 22: Creating A Pattern - Duplicate
The new pattern will show in the list of patterns as unassigned (broken link icon) until it is assigned to an Insight.
Creating an Insight
To create a new insight, switch to the Insights tab on the left side of the Manage page and follow the following steps:
- Enter the name of the new insight (again, use descriptive names for easy identification later) and make sure the name isn't already in use. When satisfied the name is unique press the "+ CLICK TO CREATE INSIGHT" button to have the new insight created.
- The insight is listed in the view and the details page is open. Use the "add meta data" option behind the name to add additional info
- Assign a severity to the insight. This will determine how it is weighted as well as which color is used to indicate its severity.
- At this moment, the insight has no assigned patterns yet. You can either enter a simple pattern directly in the Insight itself or click the "Advanced Insights" button to select one or more existing patterns, allowing you to reuse them.
- To assign an existing pattern simply drag it from the right hand side into the Assigned Pattern box that appears when you click the "Advanced Insights" button.
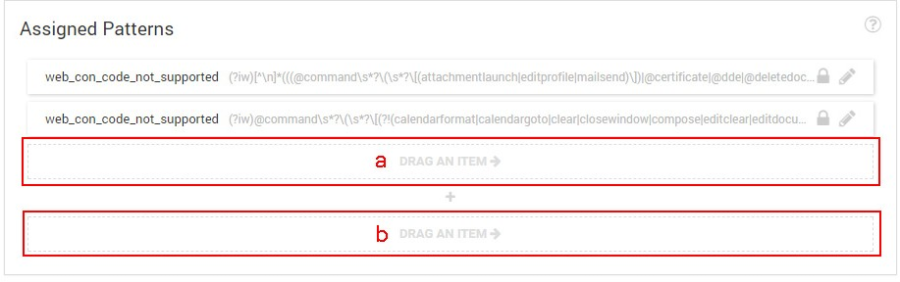 Optionally add additional patterns into either the same block (all patterns in one block are evaluated as having an OR relation, meaning that if any pattern in that block returns TRUE the whole block is considered a TRUE - a) or into a new block (all blocks in an insight are evaluated as having an AND relation, meaning that each individual block would need to evaluate to a TRUE for the insight to return a TRUE - b).
Figure 23: Creating An Insight - OR vs. And
Alternatively, you can also copy an insight by clicking the copy option behind the name. This will create a copy of the insight and copies of all the patterns in it. After copying you can then alter the new insight to add or remove patterns and change the name.
 Note: As this copy action will also create new copies of all patterns included in the copied insight it is wise to really think through what is needed. Creating loads of copies of existing patterns might be confusing to manage and it might be better to create a new insight and reuse the existing patterns in combination with your new ones.
Adding system patterns (marked by the panagenda icon) into a custom insight will always result in copies of those system insights being made. It is not possible to add a system pattern directly to a custom insight.
Creating a Ruleset
To create a new ruleset go to the ruleset tab
- Enter the name for the ruleset to be created. Verify the name isn't already in use and press the "+ CLICK TO CREATE RULESET" button.
- Update the name and meta data fields if required
- Select the insights that you want to include in the ruleset
 Enable the ruleset by clicking the red 'Disabled' button in front of the name (it will turn green when enabled)
Figure 24: Creating a Ruleset - Enable
Reusing existing and panagenda rulesets, insights & patterns
ApplicationInsights comes with preset rulesets, Insights and Patterns. These cannot be changed. panagenda elements can be recognized because they have a panagenda logo behind their name in the Custom Insights page.
You can create a duplicate of a ruleset, insight or pattern (both your own as well as those provided by panagenda) by clicking the copy icon behind panagenda logo and name of the element on the Custom Insights page.
 Note: Using the copy option on either a ruleset or insight will also create new copies of all underlying insights and patterns. It is therefore wise to really think through what is needed. Having loads of copies of existing insights and patterns might be confusing to manage and it might be better to create a new insight or Ruleset and reuse the existing patterns in combination with your new ones.
Visibility of results
Custom result sets and insights will be evaluated during the evening run. This means that newly created insights do not show up in the result overviews until the next morning.
The Custom Insights will be visible in the following overviews:
- Design – Insights page: In the Design insights by ruleset and Findings graph as a separate group of findings grouped by its ruleset
- Catalog: New Rulesets and Insights are added to the Catalog as a separate column set that can be selected from the column selector dropdown. The name of the new column set will be "Insights <ruleset name>" and usually will be at the bottom of the column set list.
- Catalog – (Instance details page): In the Catalog details page for each database instance that matches the Insights selection, the ruleset and findings will be included in the Design Insights tab.
Custom Insights do not influence Impact and Complexity scores of databases.
Removing custom rulesets, insights and patterns
Rulesets, insights or patterns can be removed by clicking the little trash icon behind the name of the element in the respective overviews. But be aware that you will only be allowed to delete your own elements. Not those of others.
On deletion of a ruleset or Insight you will be prompted to indicate whether you want to also delete all sub elements (insights & patterns) as well. Be careful when doing this as underlying insights and patterns might be used in multiple rulesets and insights and deleting them will result in them being removed from those as well. If unsure it is better to eliminate the
elements starting at deleting the patterns first, then the insights and then the ruleset. As the view always shows in which element it is being used this will allow you to selectively remove obsolete elements.
Insights and patterns not included in either an insight or a ruleset will have an icon (broken link icon) indicating this. Rulesets and insights not containing any sub elements will also have an indicator (empty folder icon). These indications can help you determine what elements are and are not being referenced and can be cleaned up.
Export/Import Rulesets
In some cases you might be asked to provide an example of the ruleset you've created or receive a custom ruleset created by someone else. Or you might want to transfer a predefined ruleset from a test environment to a production environment. For this reason ApplicationInsights also provides an option to import and export custom rulesets.
To export:
- Open the ruleset to export
- Press the Export ruleset button
A JSON file will be created and added to your browsers download folder that can be transferred.
For importing, open the ruleset view and use the import icon behind the search field.
![]()
Figure 25: Import Rulesets
This will show you an option to select or drag and drop the JSON file containing the ruleset. At which point the ruleset will be created or, if it was a pre-existing ruleset, overwritten. If you want to prevent a previously exported ruleset from being overwritten when importing an older or changed version of that same ruleset it is best to first clone the ruleset on your system and save it under a different name. That way you will still have the ruleset even though the original is overwritten on import.
Rights
Administrators are only allowed to edit the rulesets, insights and patterns created directly on the ApplicationInsights appliance itself. Elements and rulesets imported from other systems can be cloned and or removed but the individual elements of these imported rulesets cannot be changed.
Elements created by panagenda cannot be changed or removed. They can be disabled (rulesets) and or cloned if necessary.
Support & Help
Additionaldetailsareavailableintechnote2001728-Q&Aabout panagenda ApplicationInsights and the offering for entitled IBM customers with link: {*}https://ibm.co/2plriSL*
If additional support is needed, please contact support or submit a ticket. To do so click in the right upper corner on the "?" icon and follow the links "Support" or "Submit a ticket".