We just announce a new major release of GreenLight, the Monitoring Solution for HCL Domino and others.
It includes now a new Frontend based on HTML5 which can be used for Dashboards, Grids and Visualizations.
The most notable features and improvements are listed below.
Important Information
Please make sure that you are using the latest GrrenLight version 3.5.3 before you run an update!
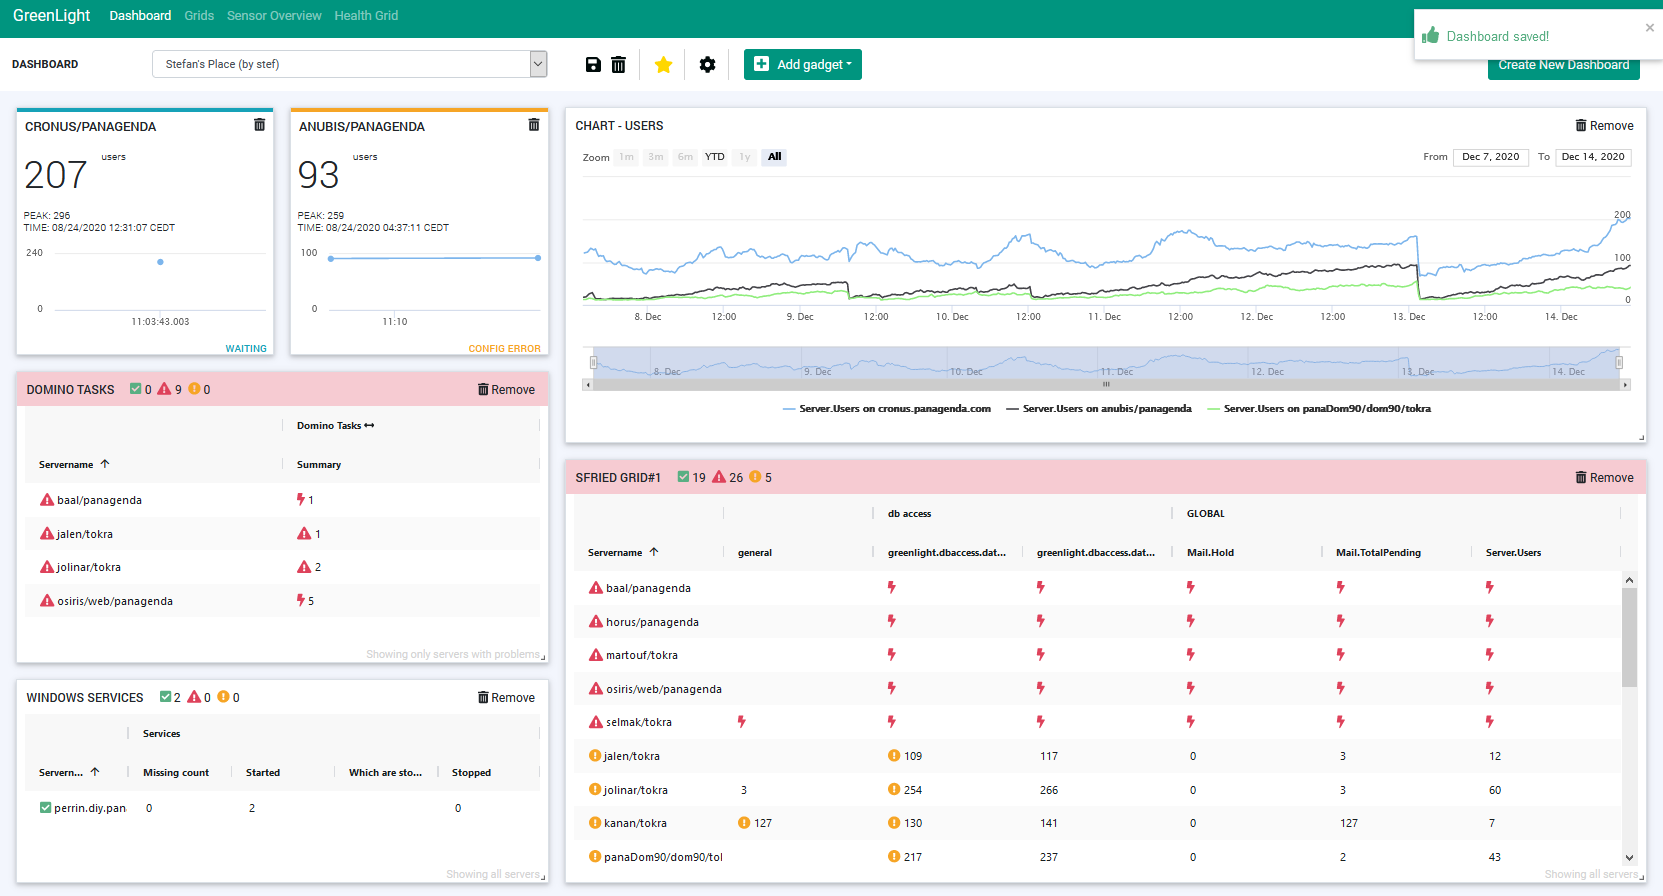
| New Feature | Dashboard(s)Dashboards are the new way to go where you can build multiple Dashboards based on your needs. A Dashboard contain several Grids, Charts, Server Cards which can be positioned at any location. The screenshot shows you an example.
One can create as many Dashboards as you like and you can specify if they should be visible for other GreenLight Users or not. |
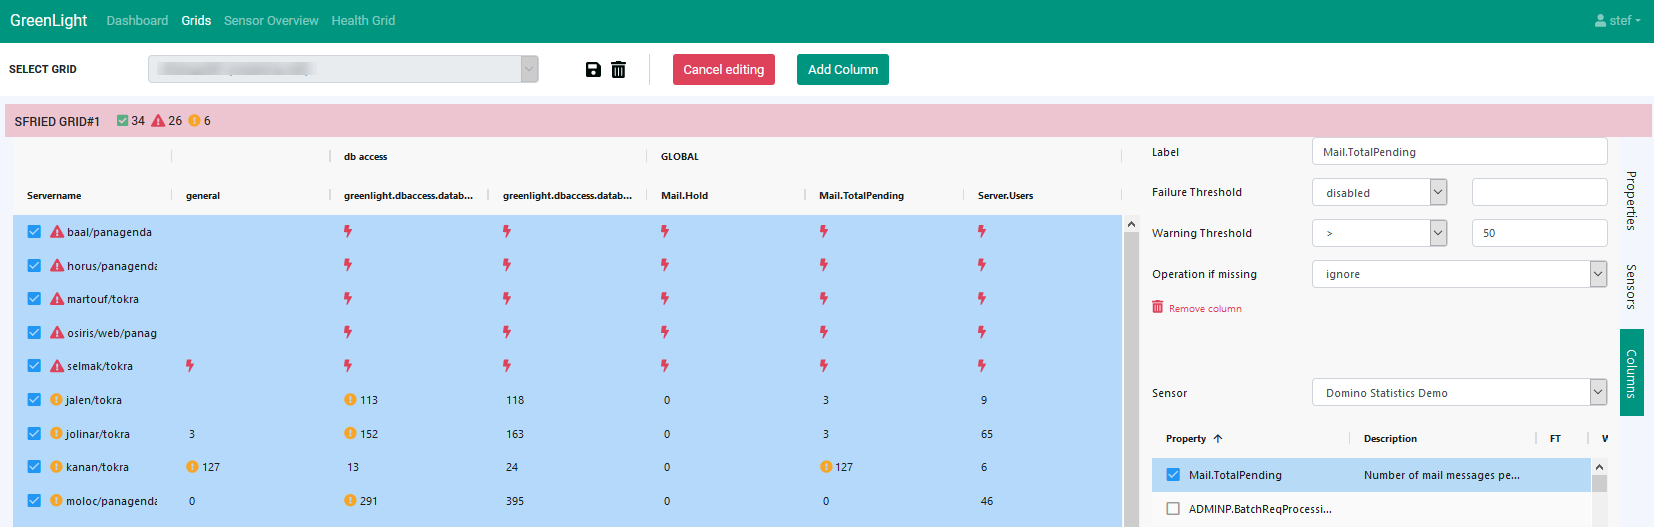
| New Feature | GridsA Grid is a configuration based on server, sensor keys and sensor values. On top of it you can assign threshold figures for every column you add.
Again, like with Dashboards, you can create as many grids as you like |
| New Feature | Domino Server Cards |
| New Feature | Charting |
| New Feature | Sensor Overview |
| New Feature | Metabase |
| New Feature | DataMiner |