Note! It is required to have TrueDEM agent version 1.8.6 or higher installed for certain features described below to work. If not sure, please check The TrueDEM Agent status page.
New in portal:
The portal has been extended with several new features and has now been designated as the new default homepage. This includes menu's to go to underlying reports and dashboards.

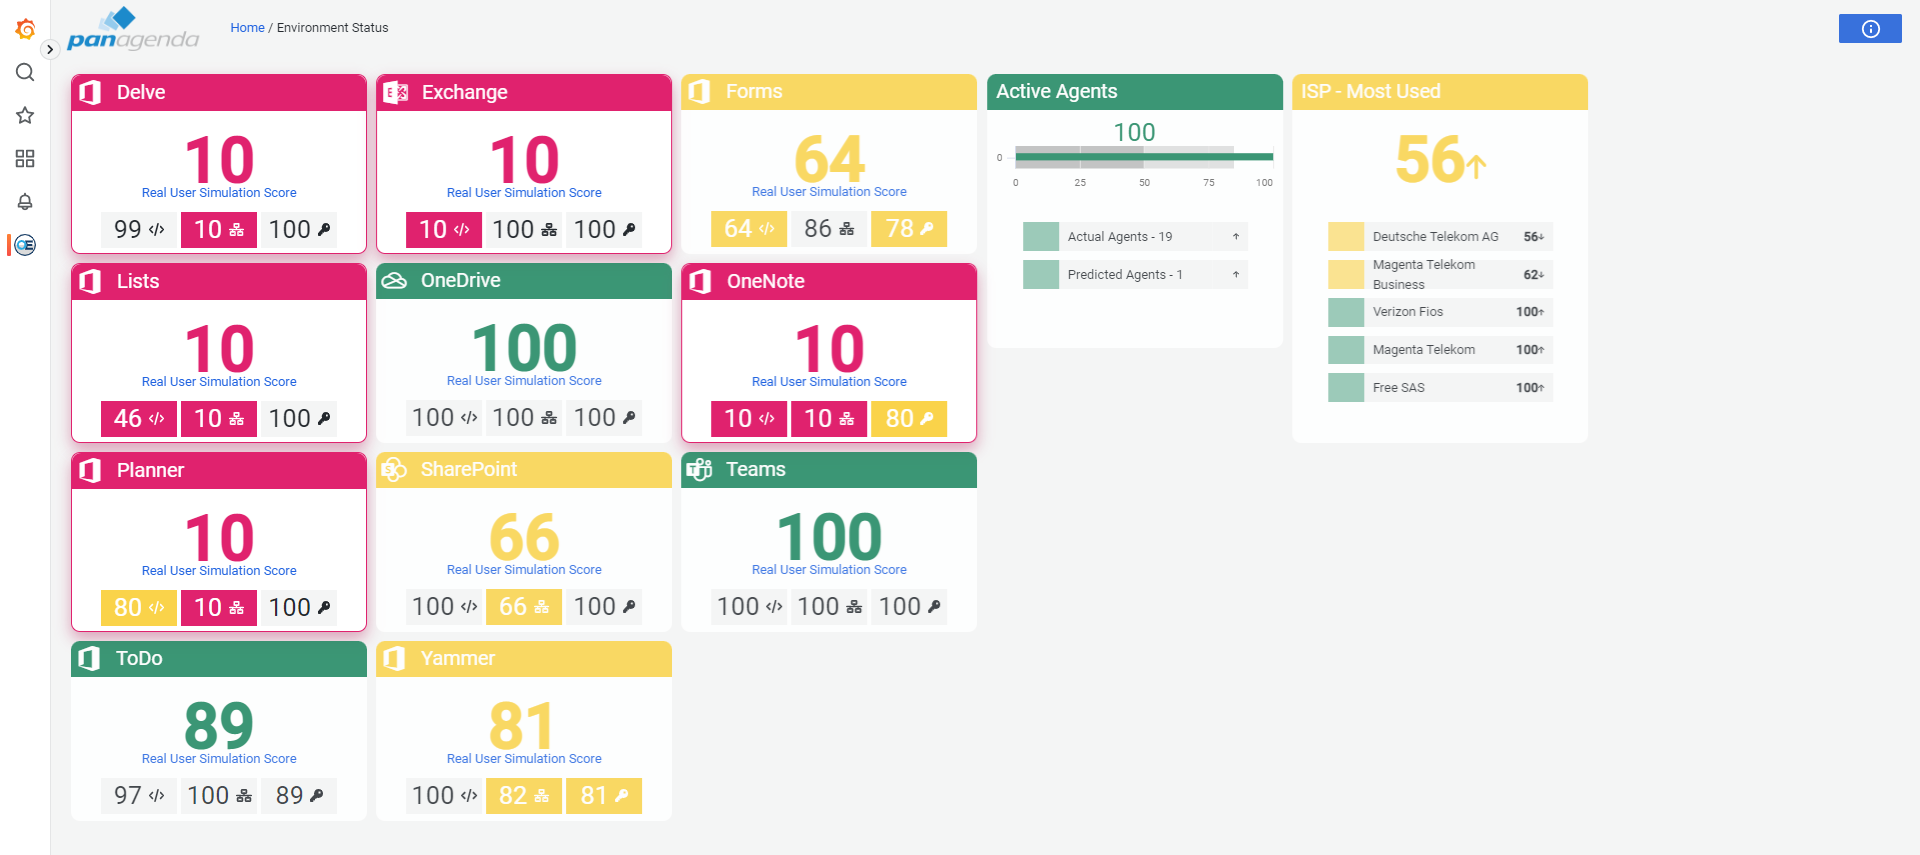
Extended services monitoring for environment Status:
Environment Status now shows the scoring of all main Microsoft 365 E3 services based on our own TrueDEM technology with a score of 0 (completely down) to 100 (operating within or above the range of what is to be expected as normal for the organization in the last three weeks around the same time).
This page shows the performance quality of the TrueDEM monitored services. For each service, three aspects are monitored and scored:
- Service API response
- Network connectivity
- Authentication
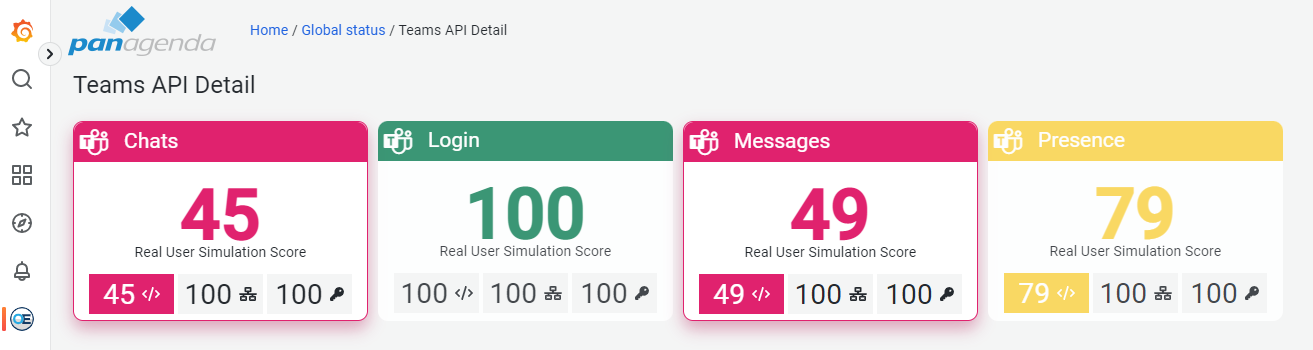
The overall score is that of the lowest scoring aspects as mentioned above. To see more details and performance for the underlying services, click on a services to get more details which are again scored on the three aspects of authentication, login and API response1.
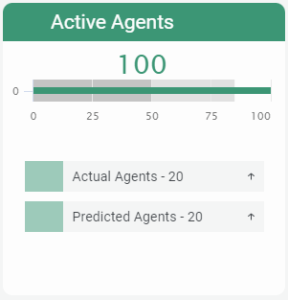
The Environment Status page also shows you the number of currently reporting agents compared to what was expected based on similar days/timeframes in previous weeks. This can be seen as a good indicator of connectivity problems. For instance when you see a sudden dip in reporting agents that can't be explained away by a national holiday or other events.
Ease of Navigation:
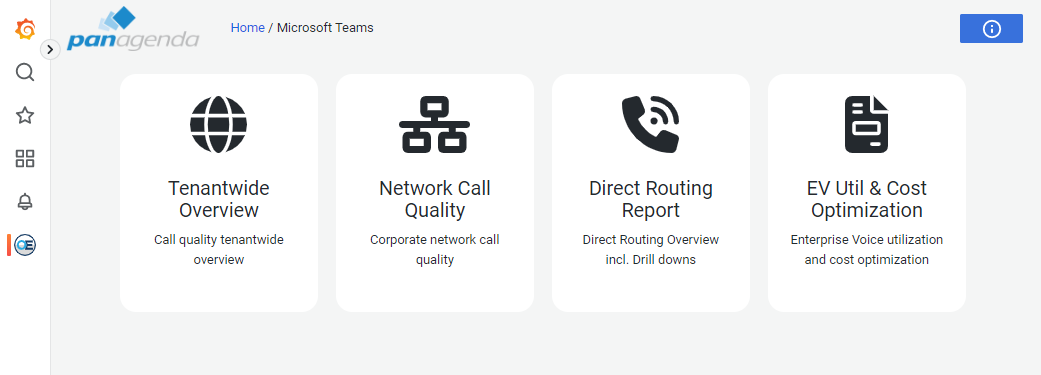
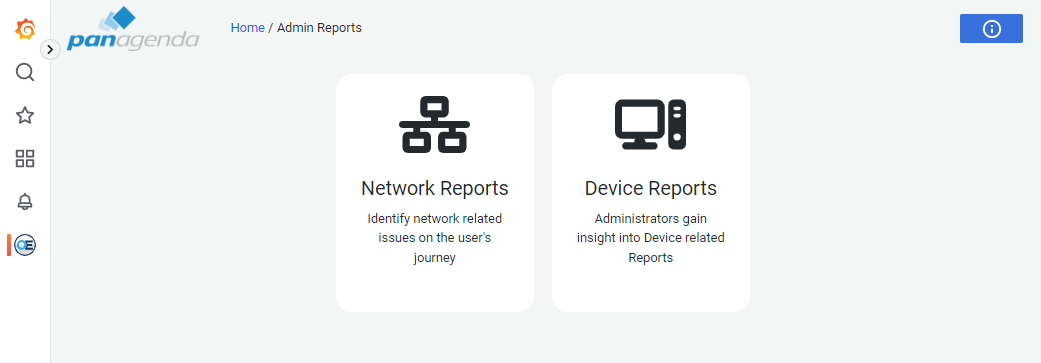
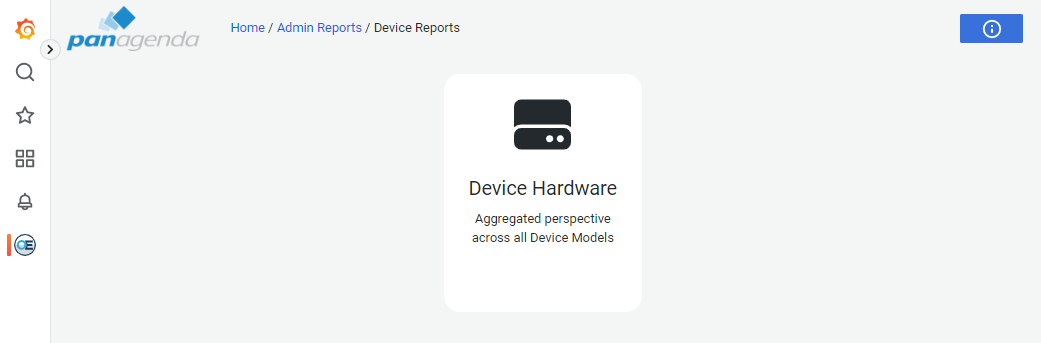
The new portal links for Admin Reports and Microsoft Teams from now on will take you to all the relevant reports and dashboards that were previously only accessible through the Grafana browse feature.
Additionally, all portal sub-screens use bread crumbs for easy navigation and all Grafana dashboards and reports now also have a "Home" button that will take you back to the portal homepage.

The existing folders under the Grafana Browse feature have been cleaned up as well. With obsolete dashboards moved into the Legacy folder.
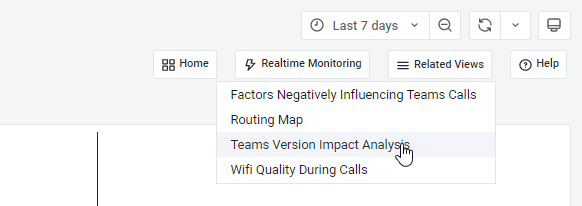
The user specific reports: Factors Negatively influencing Teams Calls, Routing Map, Teams Version Impact Analysis and Wifi Quality During Calls are now all linked directly from the User Details page via the "Related Views" menu in the top and will open with the right user and device (if applicable) selected.
New in Dashboards:
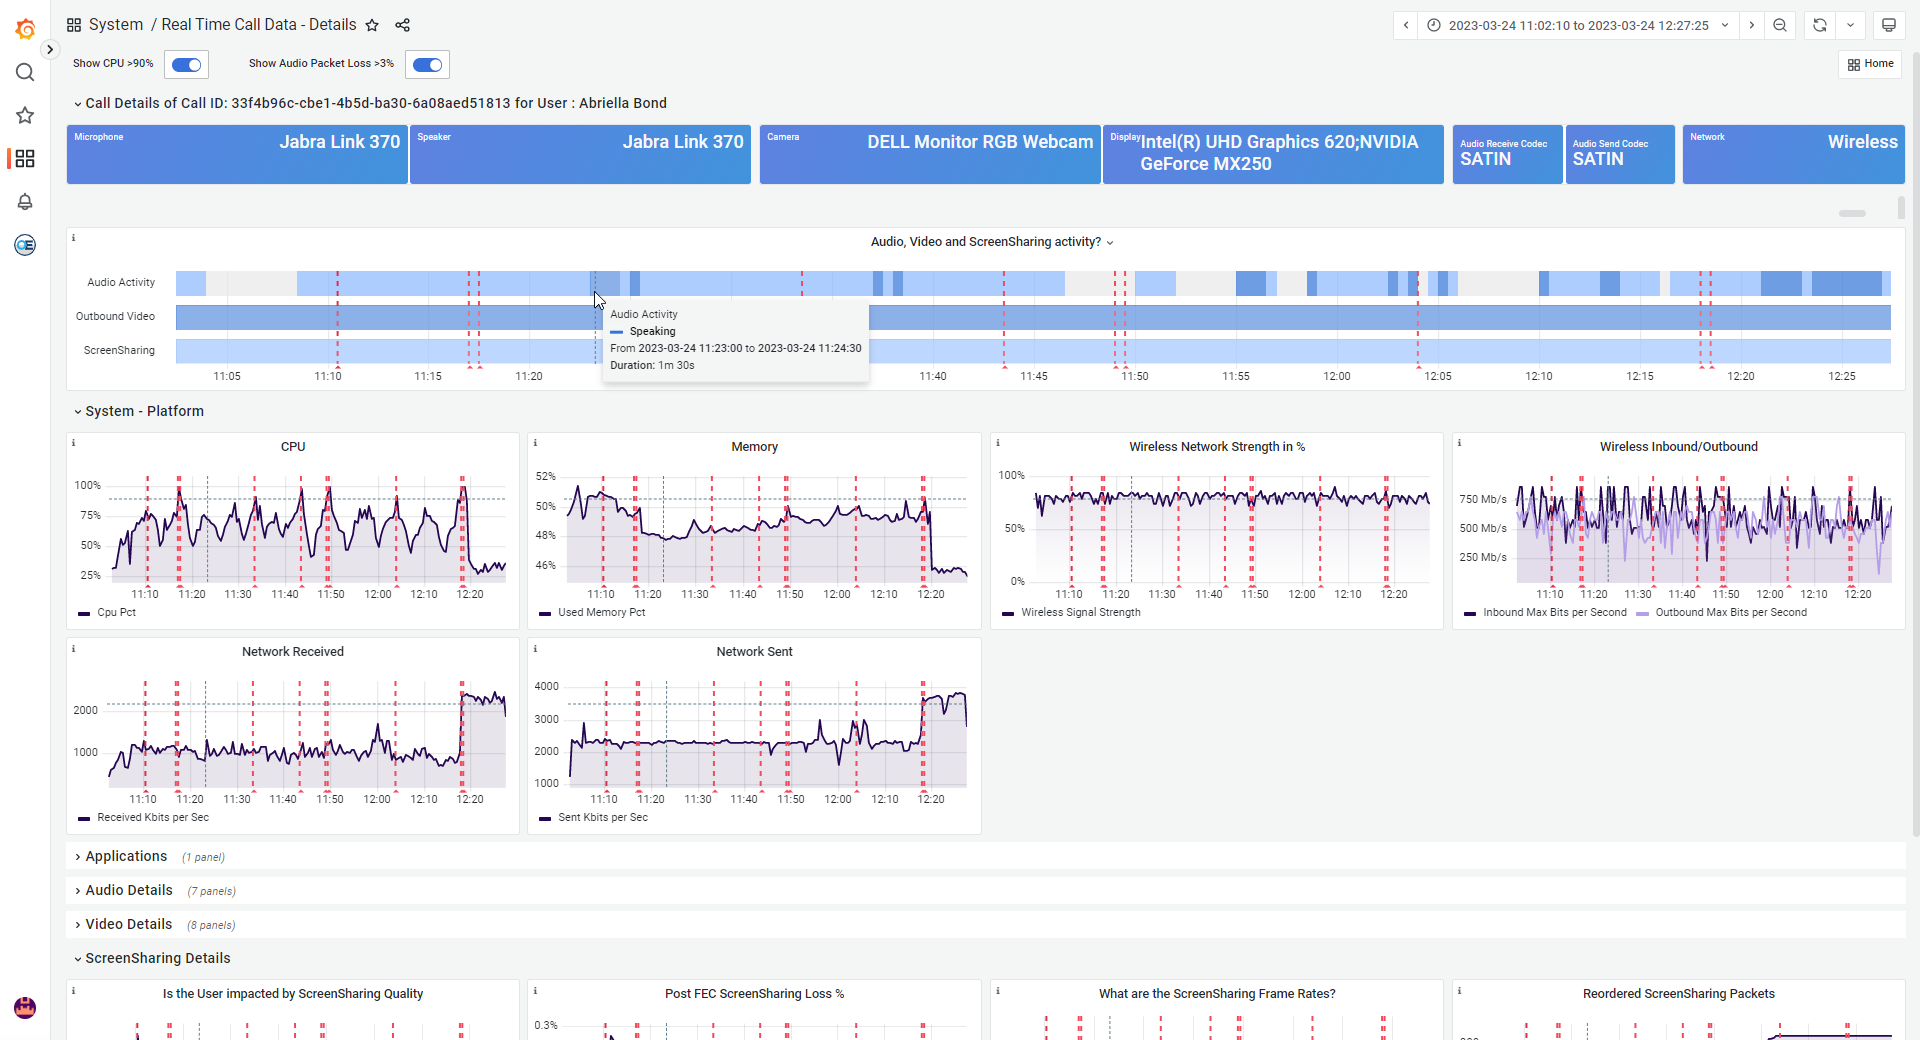
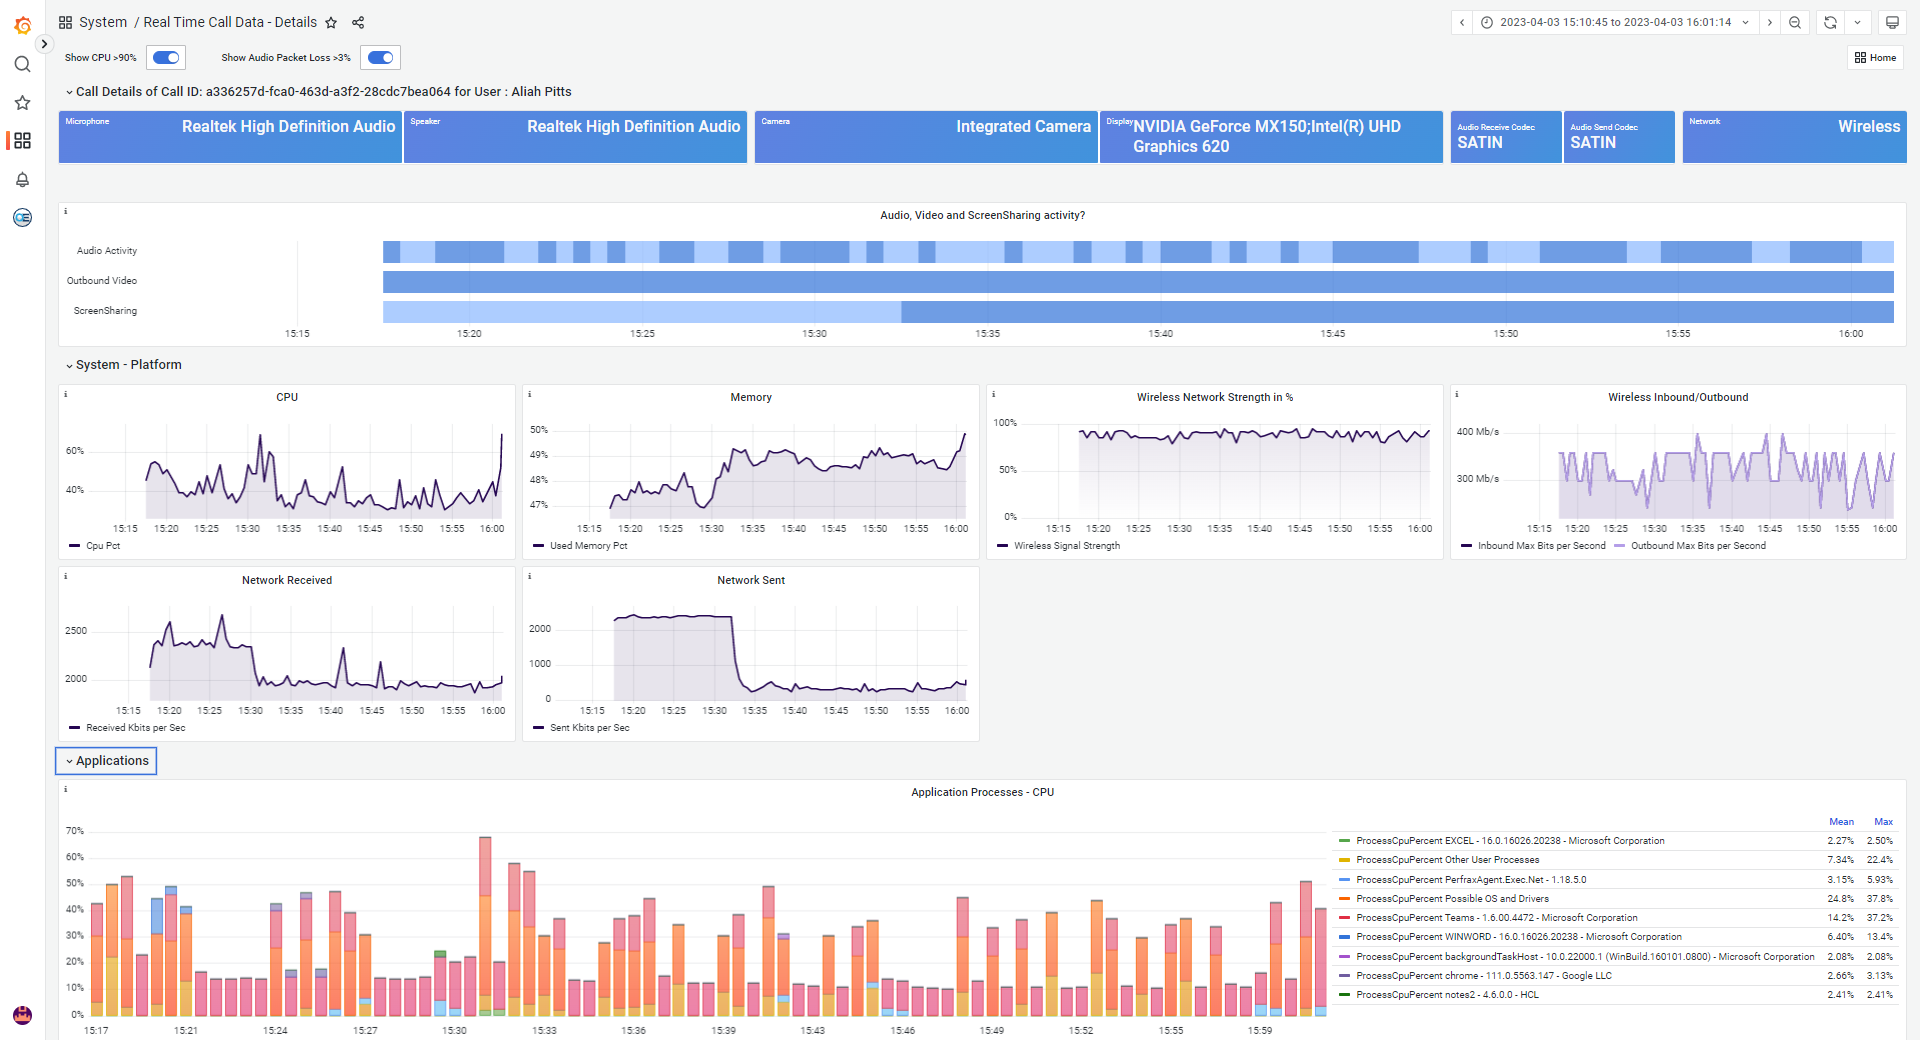
New & Improved Real Time Call Data - Details page
The existing Real Time Call Data details page was replaced to include many more new data points. This page can be used to do retrospective research into any call on a monitored device and gives you the most comprehensive view of what went on during a call with the users call experience.
Key changes:
- Direct insight into the users activities during the call in terms of audio, video and screen sharing participation
- An in-call anaylsis of the top CPU consuming processes (Note! This will only be available for new calls, not for calls made before the release of this feature)
- Multiple new Metrics were added for Video sharing, screen sharing and audio
Preview features:
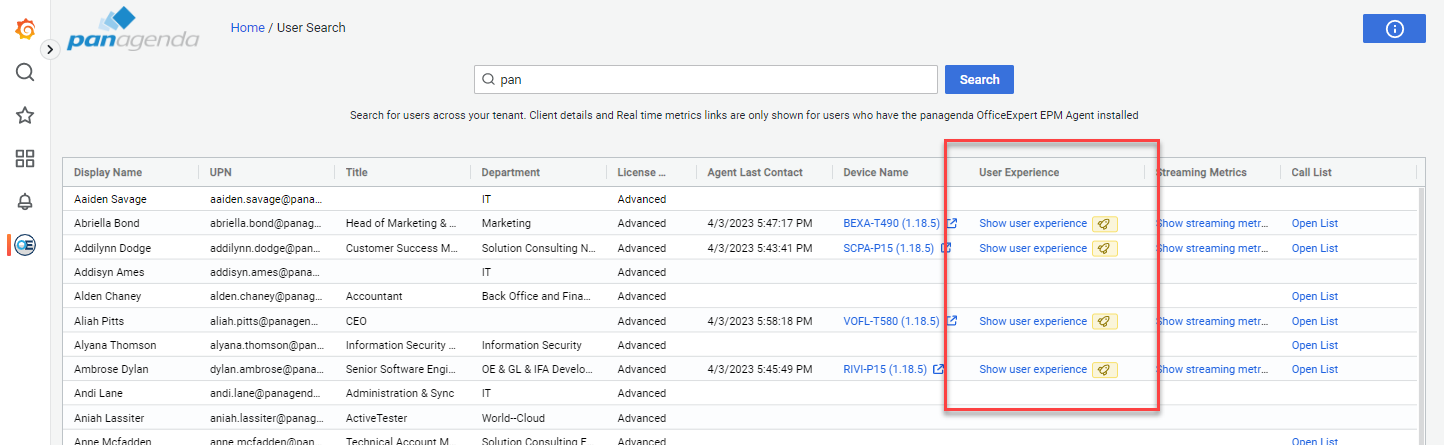
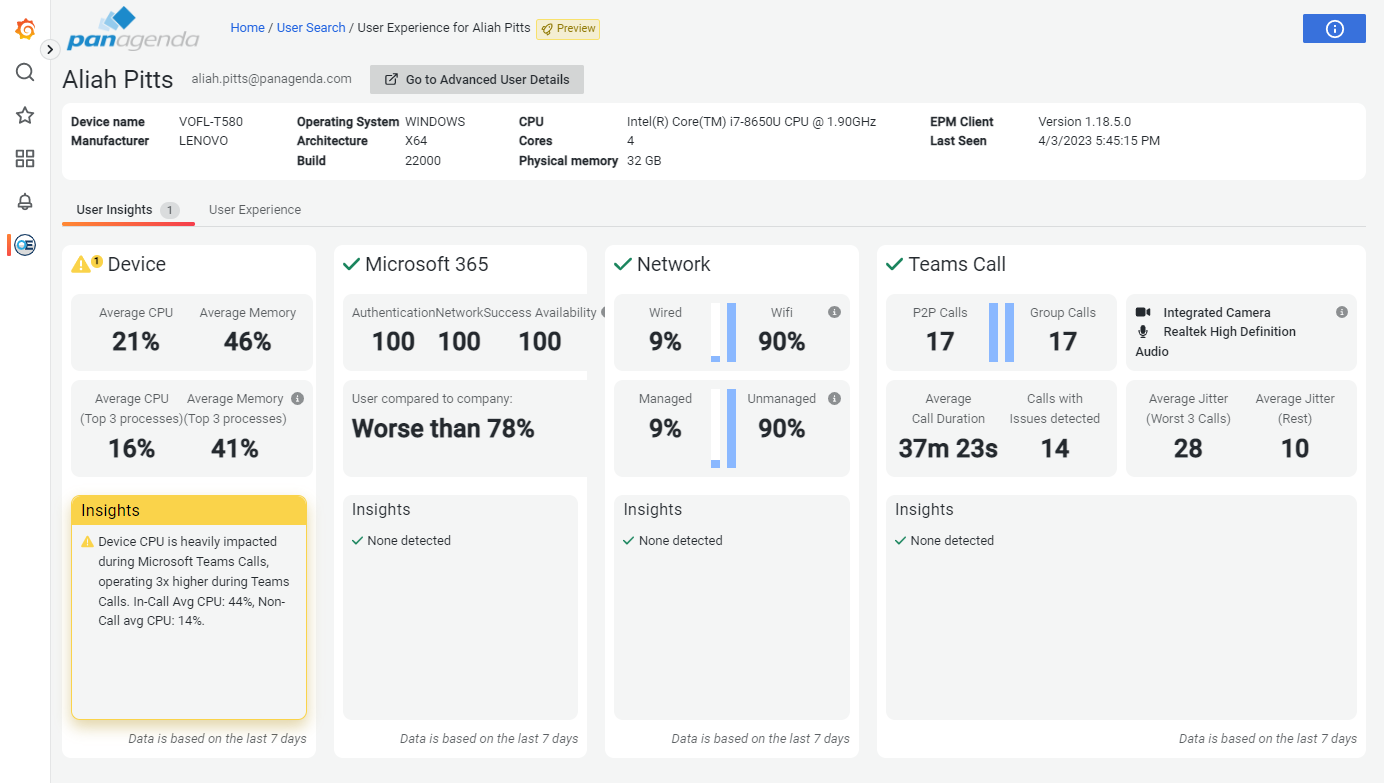
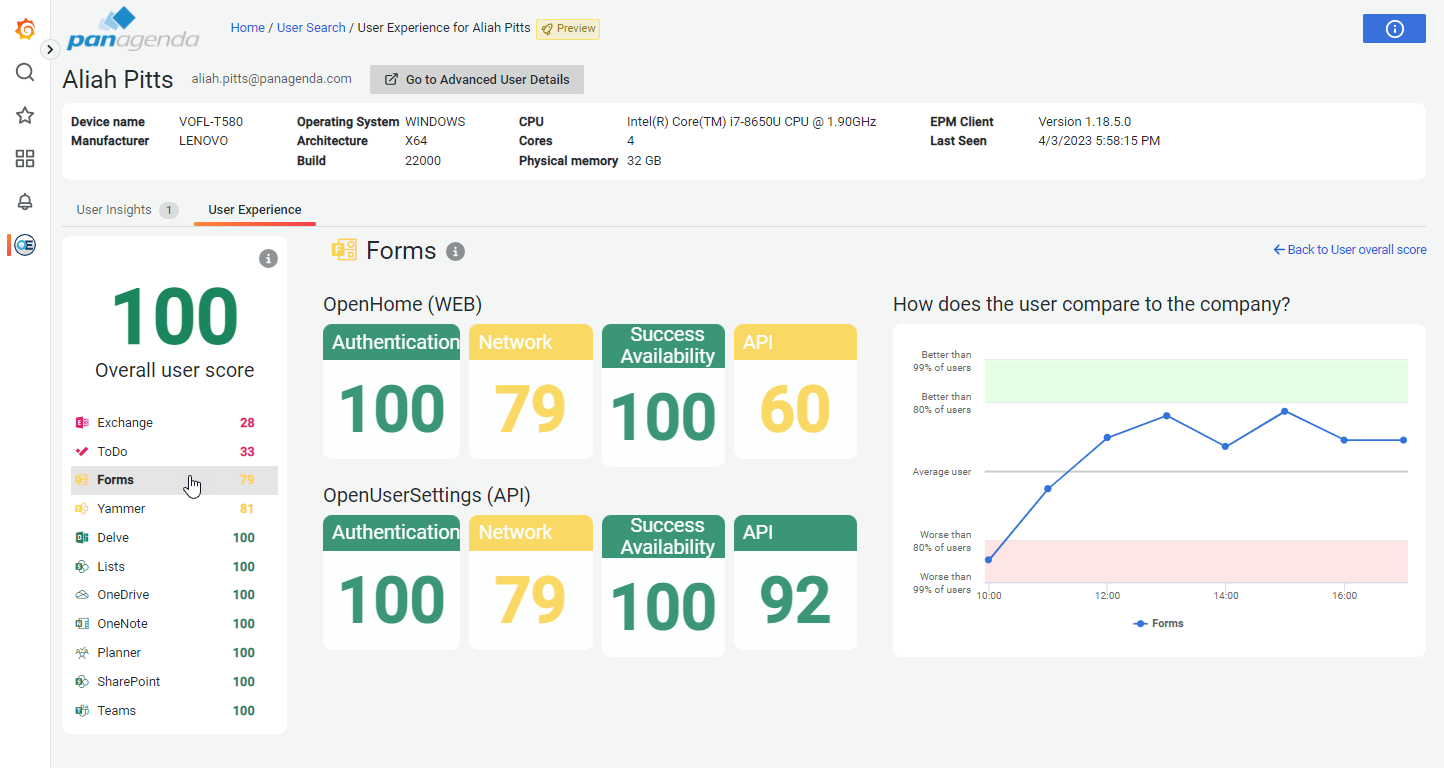
Preview: User Experience page
Through the user search you are now able to preview a page depicting the individual User's experience. The page is still in development and will likely change.
The goal of this page is to provide a first high level insight with recommendations on a specific user. As said, the number of recommendations will be gradually expanded. The second tab provides insight into the individual users experience of the various M365 services in comparison to that of the organization. From here the admin can choose to dive deeper into the users details by opening the User Details page (button in the top).
Additional Updates & fixes:
1If a customer hasn't consented yet to the new requirements coming with agent version 1.18.x than there will be a temporary period in which the data on the Environment Status page (service scoring) can be unreliable. We are implementing an adjustment in the backend to still support these organization but as the data we collect for them does not have the same depth needed to perform the newer calculations it will take a few weeks of data collection for the environment status scores to be up to the same reliability as for customers who did consent. We advise these customers to be vigilant of this. Customers who did consent can rely on the scoring immediately