The following report provides insights into the Team's media usage of video and screen sharing across departments.
This analysis aims to enhance our understanding of media usage and improve overall efficiency and user satisfaction.
There are three primary reasons why this data is valuable:
Enhanced Employee Experience: Understanding video usage patterns can help IT teams address any technical issues that may be affecting the employee experience.
Proactive Problem-Solving: Video usage will vary between enterprises and departments, but usage rates tend to be relatively consistent across a large company. When specific locations demonstrate significant variances from the company's average, it often indicates that users are encountering difficulties, even if they have not reported them.
Department-Level Analysis: Aggregating video usage data at the department level provides a macro perspective on how different teams utilize video communication.
What
This is a summary report for the last 7 days of data. Individual users will not be visible on this page. All departments with fewer than 5 users will be grouped under a single department name called "z - Small Departments" to protect their employee privacy.
User calls / Occurences:
The report is based on user calls (occurrences) rather than distinct team calls. When you observe 29 calls on "Meeting/Windows/Audio Only", this indicates that 29 users participated in a Meeting from a Windows platform where they used using only audio. So it is possible that these were 29 users were joining the same call, that 1 user joined 29 calls, or multiple users joined different calls.
Elements on the Page
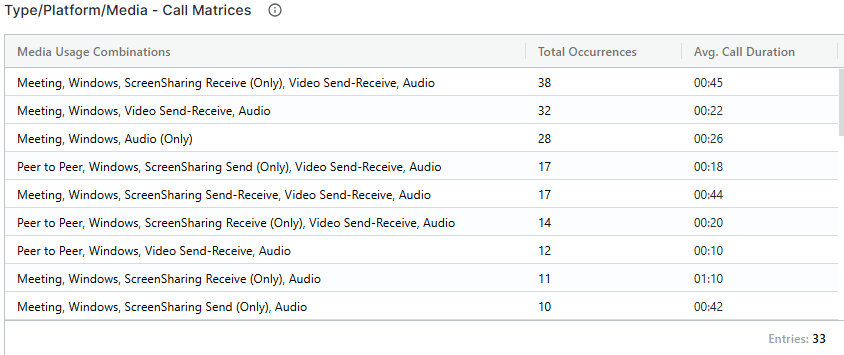
Type/Platform/Media Combinations
This list at the top provides organization wide information about how users are using the options for audio, video and screensharing across operating system platforms and types of calls (Meeting / Peer to Peer / PSTN).
Available Columns:
- Media Usage Combinations
- Call type/Platform/Media combination
- Total Occurrencess
- Number of User Calls or Occurrences (see above short explanation about User calls)
- Avg. Call Duration
- Average Call Duration for the respective Combination
- Media Usage Combinations
Overall analytics
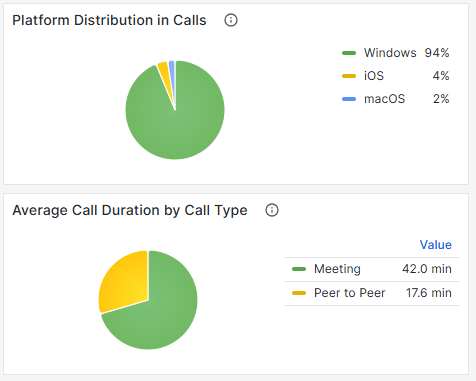
Platform Distribution in Calls: Platform distribution for calls in the past 7 days.
Average Call Duration by Call Type: Analysis of average call duration categorized by call type
Teams Media Summary by Department
This Grid includes all departments (except those with less than 5 members, grouped under "z- Small Departments") with media combination and usage metrics. The grid is customizable and exportable based on your needs.
You can view data per department or overall media usage across the entire tenant.
Ignore the sum(), avg(), and max() parts of the column headers. The valid text is always inside the brackets.
Default view:
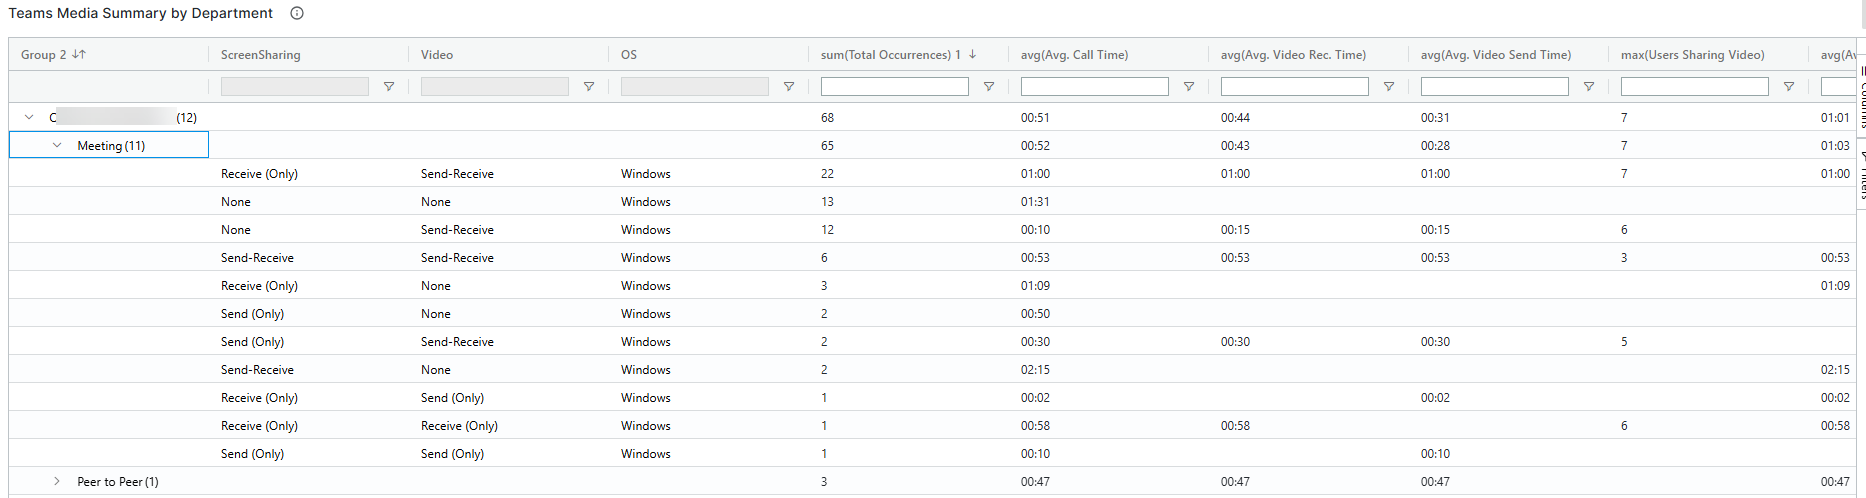
Columns:
- Dept.
- Name of the Department
- Department with less than 5 members are grouped under "z - Small Departments"
- Type
- Type of the Call. Meeting, Peer to Peer, PSTN
- ScreenSharing
- Possible combination how ScreenSharing can be used: None; Receive (Only); Send (Only); Send-Receive*
- Video
- Possible combination how Video can be used: None; Receive (Only); Send (Only); Send-Receive*
- OS
- List of allused Platforms like Windows;iOS,macOS, Android
- Total Occurrences
- Number of User Calls or Occurrences (see above short explanation about User Calls)
- Avg. Call Time
- The average length for the combination across all occurrences.
- Avg. Video Rec. Time
- The average video receive length for the combination across all occurrences.
- Avg. Video Send Time
- The average video send length for the combination across all occurrences.
- # Other Depts in Calls
- The number of other departments joining these call combinations for the selected Department.
E.g. Five indicates that the selected department and media combination interacted with five other departments.
- The number of other departments joining these call combinations for the selected Department.
- % of Attendees in Dept.
- The percentage ratio between internal department users and other departments.
- For instance, 35% of attendees in total user calls come from the selected department.
- Or a 100% ratio means this media combination is used exclusively by attendees from a single department.
- % of Total Dept Calls
- The percentage ratio of calls in the department where at least one of the users of that department used the selected media combination against the total number of calls.
- For example, 80% indicates that the combination is primarily used in the department.
- Note! "% of Total Dept Calls" refers to a different % then the number of occurrences (as multiple users of the department can be in the same call) against their total. Therefore the percentages can be greater than 100% when added up. If the added up number is close to 100%, this indicates that the behavior is consistent across department users. A greater difference can indicate that some users show different behavior in the same calls than others of that department.
- Dept.
*Classifications for media usage (video / screensharing):
- Send: The user was actively using the media
- Receive (only): The user was not using the media themselves but others in the call were
- Send-Receive: Both the user as well as others in the call were actively using the media.