The User Experience page gives insight into the performance of measured M365 services for the individual user. Measurements represent the results of quality tests to the M365 services for the user from their device and within their context compared to the performance of these services for the user in the previous weeks. Low numbers can indicate a worsening or improvement of the situation. However, do keep in mind that low numbers don't necessarily mean that the user experiences problems themselves yet. If they do though, this page can help identify in which area of responsibility (authentication, network or Microsoft Services) an admin should perhaps start with problemshooting.
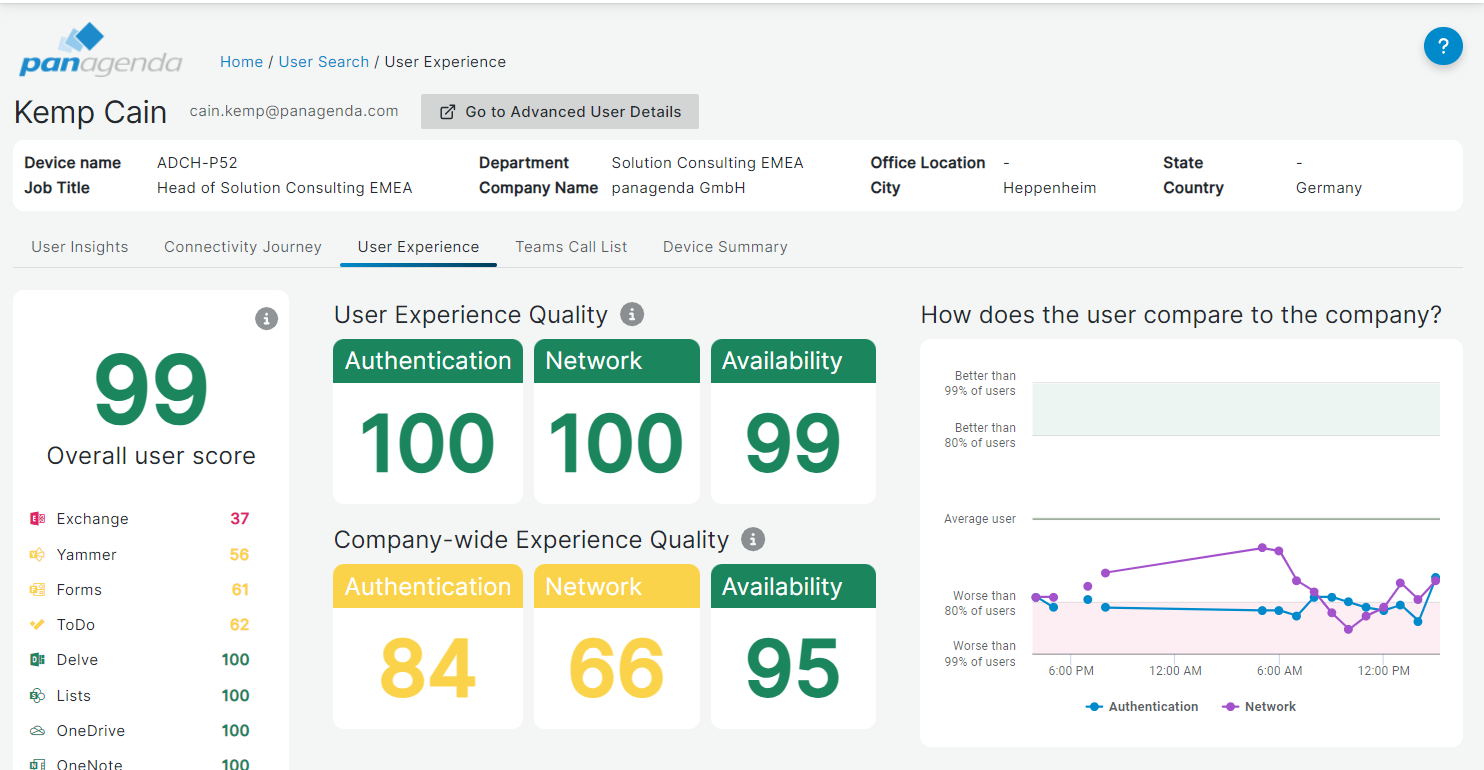
The first page shows the M365 User Experience quality compared to that of the organisation overall as well as a time line that depicts how that comparison developed over the last 24 hours. Quality is meassured across three elements that are tested:
Authentication: Were there issues authenticating to the services?
Network: Were there issues with the network elements to connect to the services (Office/home network, ISP, Microsoft Network)?
Availability: Were the test successfull in reaching the M365 or did the tests fail to connect?
Individual M365 Service scores:
Numbers for individual services are available from the list on the left. Clicking on a service will give you insight into the test results for the service and subservices tested. Here, one additional component score is added: API . The API test depicts if the test received successful testresults from the backend API at Microsoft. A low score on this could indicate issues with the Microsoft environment itself. However, keep in mind that low scores are visible on Authentication and/or Network as well, that there can be a combined issue or dependency causing the low score.
