Grids provide you various options to organize the monitoring information from your IT environment in exactly the way you need them. Grids can then be used in dashboards.
Contents:
Add Grid
To start the grid creation, click on the Add Grid button at the right hand side top corner of the GreenLight user interface. You will see the following dialog:
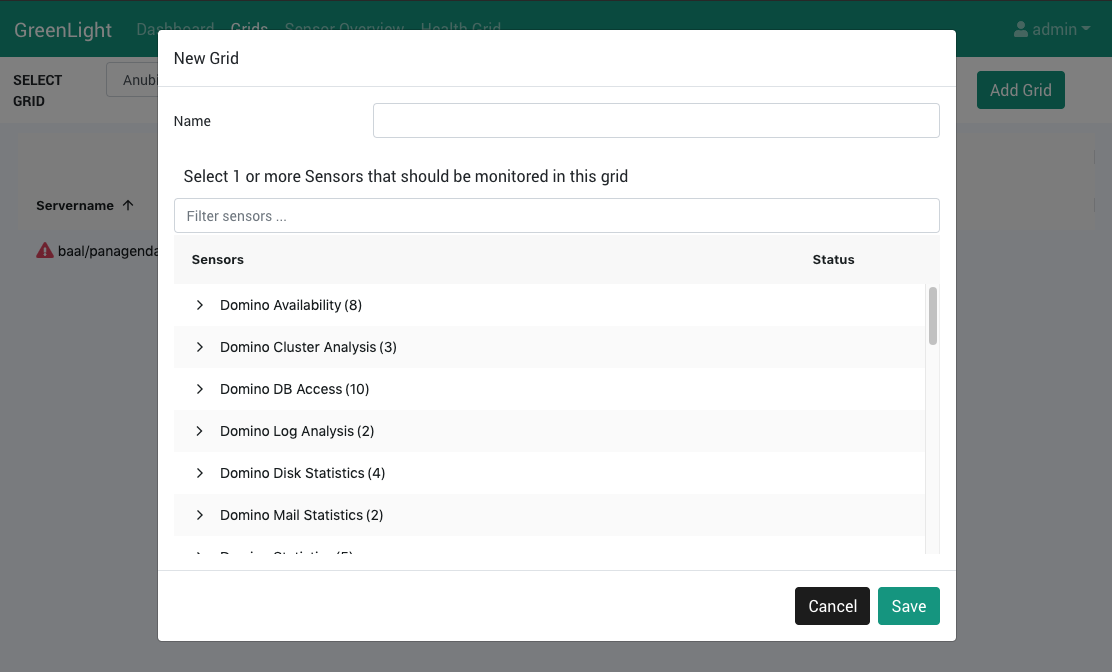
Give your grid a meaningful name and select one or more sensors from the list (the selection and also the name can be edited in a later step). After hitting the Save button, you will find yourself in the Grid Editor.
Grid Editor
The leftmost column is named Servername and lists all servers and clusters (nodes) that are available for the selected sensor(s). Use the check boxes to include or exclude nodes from your grid. For newly created grids of all sensors but Domino Task Status, you will not see any further columns. The following configuration sections are available:
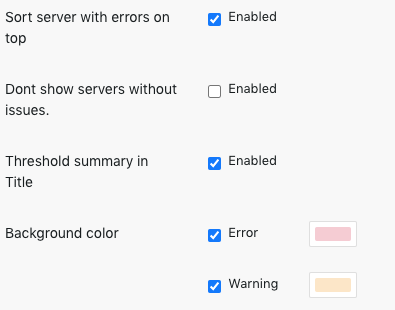
Properties
Here you can edit the name of your grid, add a description and set some appearance properties:
Sensors
In this configuration section you can edit the sensor selection for your grid.
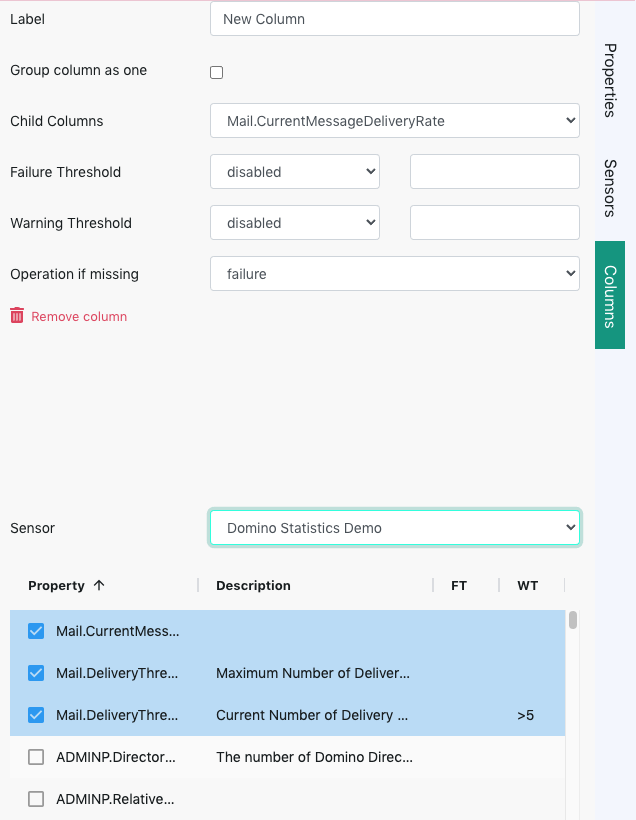
Columns
Before you see anything in this configuration section, you will have to hit the Add Column button (exception: Domino Task Status - for this sensor type the column structure is set automatically).
Once a column was added, you will se a lot of settings in this section:
The respective configuration depends on the type of sensor, your monitoring requirements and so on. We recommend to watch the following explainer videos to get a better idea how you can set up a grid that fulfills your requirements:
- How to create a Grid - example 1
- How to create a Grid - Tasks example (Domino Task Status)
Do not forget to click on the Save icon when you are done with your edits!
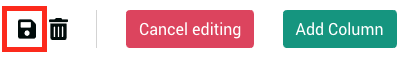
Hit the Cancel Editing button to quit the Grid Editor.