This page displays real-time metrics gathered by our agent during a call for a specific user. To access this page, first select a call from the call list and then click on the “Real Time Data” link corresponding to the user you wish to inspect.

At the top you will have insight into the third party devices used, Teams version, Codec and network type. Below you’ll find a donut chart showing the issues detected and how many intervals of 30 seconds thes occured during the call.
Next to this, a timeline shows you what the user utilized (Audio, Video, Screensharing) during the call and in what form. Dark blue indicates it was active (for audio: speaking), light blue means it was active but no ultilized (for audio: not speaking) and gray means it was deactivated. Below that another timeline shows the consecutive issues that occured at what time. Note! Not all issues are shown here, just the once that impacted more than one consecutive 30 second interval.
On the right a section shows changes occuring for Network/Audio and Video. Changes can be anything, like changes in the codec used or switches from network or Wi-Fi network. These also appear as grey time indicators in the various graphs. Details about the changes can be viewed in the sections lower on the form. Below the changes, the list of users in the call who had an agent installed is shown. Note! If you switch users using this list, then please be aware that if you were investigating a call as it was going on (live), the subsequent page does not automatically refresh
The page is further divided into separate sections for Applications, Audio, Video and Screensharing with specific metrics for each. For information on individual graphs & metrics, click the little  in the top left-hand corner of the graph you’re interested in.
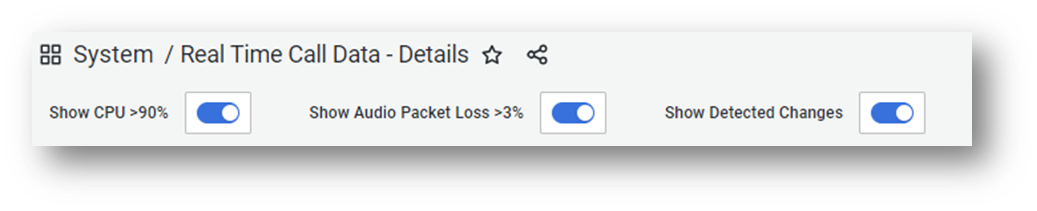
Apart from the change indicators there are also warning thresholds for when a device goes over 90% CPU utilization and when the Audio Packet Loss is greater than 3%. These appear as red line indicators when they occur.
Visibility of warnings and changes can be enabled/disabled using the toggles in the top.