As announced by Adobe, the support for the Flash technology ended with the year 2020. Therefore we implemented a completely new HTML5 monitoring interface for GreenLight which includes:
- A sophisticated Dashboard
- a Grids page to create customized data views, which can also be displayed in the dashboards
- a Sensor Overview to gain quick insights into measurement details
- and an HTML version of the Health Grid which is equivalent to old Flash version.
For further details, please refer to the Release Notes v4.0.0.
1st Login after the Upgrade
When you log into GreenLight for the first time after the upgrade, you will see the following screen:
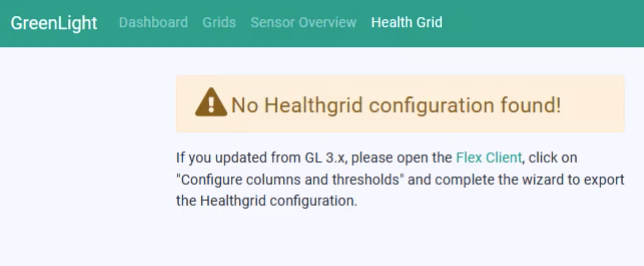
Please follow the instructions in this message. If you need help with exporting the GL 3.x Health Grid configuration, please refer to the explainer video How to export the HealthGrid.
Basics
The right path of getting started with GreenLight 4 is to click through the menu from right to the left:
- Import and adapt your GL 3.x Health Grid
- Use the Sensor Overview to check your measurement details
- Create Grids to organize your monitoring information
- Use these Grids in your Dashboards.