Pinpoint network issues from device
to Microsoft’s cloud

The network path crosses half a dozen boundaries: Wi-Fi, VPN, corporate network, ISP, public internet, Microsoft’s edge. A problem at any point degrades the experience. TrueDEM traces the complete journey for every user.

What is TrueDEM network intelligence?

TrueDEM’s network intelligence gives IT teams M365-specific visibility into every layer of the network path between a user’s device and Microsoft’s cloud, including local Wi-Fi quality, VPN routing impact, corporate network routing, ISP behavior, and the distance to Microsoft’s data centers. Unlike generic network monitoring tools, TrueDEM measures from the user’s perspective and correlates network performance with M365 service quality. Built by panagenda as part of the TrueDEM platform.

The network is always the first suspect, and the last to be proven

When M365 performance degrades, "it must be the network" is the default assumption. But proving where? That’s where things fall apart.

The path is different for every user

A user in the office hits Microsoft through the corporate network and a managed egress point. A user at home goes through their home Wi-Fi, ISP, and directly to Microsoft’s edge. A user on VPN gets routed through the corporate gateway first, potentially on another continent. Every path is unique, and they all change depending on time of day, network load, and ISP routing decisions.

Traditional tools monitor the wrong thing

LAN/WAN monitoring tools are optimized for data center and office infrastructure. They don’t extend into home networks, can’t see ISP routing, and have no visibility into how the network specifically affects M365 traffic. You might know your corporate WAN is healthy while users on it are experiencing poor Teams call quality.

VPN configuration is a silent performance killer

Full-tunnel VPNs route all traffic, including Teams media, through the corporate gateway, often adding hundreds of milliseconds of latency. Microsoft mandates split tunneling for Teams, but verifying whether it’s actually working across your user base is difficult without endpoint-level data.

Wi-Fi is a black box at scale

You can configure and monitor corporate Wi-Fi access points. But you have zero visibility into users’ home Wi-Fi, signal strength, channel congestion, band selection. And even corporate Wi-Fi can have dead spots, overloaded access points, or users roaming between BSSIDs mid-call.

ISP quality varies by location and time

An ISP that works well for one office location may perform poorly for another, or at certain times of day. Without per-user, per-ISP, per-location data, you can’t prove an ISP problem, let alone escalate it with evidence.

TrueDEM maps the complete network journey for every user, from their device through every hop to Microsoft’s cloud, so you can stop suspecting the network and start proving exactly where the issue is.

The network is always the first suspect, and the last to be proven

When M365 performance degrades, "it must be the network" is the default assumption. But proving where? That’s where things fall apart.

Every path is unique

The path is different for every user

A user in the office hits Microsoft through the corporate network and a managed egress point. A user at home goes through their home Wi-Fi, ISP, and directly to Microsoft’s edge. A user on VPN gets routed through the corporate gateway first, potentially on another continent. Every path is unique, and they all change depending on time of day, network load, and ISP routing decisions.

Wrong tools

Traditional tools monitor the wrong thing

LAN/WAN monitoring tools are optimized for data center and office infrastructure. They don’t extend into home networks, can’t see ISP routing, and have no visibility into how the network specifically affects M365 traffic. You might know your corporate WAN is healthy while users on it are experiencing poor Teams call quality.

VPN performance killer

VPN configuration is a silent performance killer

Full-tunnel VPNs route all traffic, including Teams media, through the corporate gateway, often adding hundreds of milliseconds of latency. Microsoft mandates split tunneling for Teams, but verifying whether it’s actually working across your user base is difficult without endpoint-level data.

Wi-Fi black box

Wi-Fi is a black box at scale

You can configure and monitor corporate Wi-Fi access points. But you have zero visibility into users’ home Wi-Fi, signal strength, channel congestion, band selection. And even corporate Wi-Fi can have dead spots, overloaded access points, or users roaming between BSSIDs mid-call.

ISP unprovable

ISP quality varies by location and time

An ISP that works well for one office location may perform poorly for another, or at certain times of day. Without per-user, per-ISP, per-location data, you can’t prove an ISP problem, let alone escalate it with evidence.
TrueDEM maps the complete network journey for every user, from their device through every hop to Microsoft’s cloud, so you can stop suspecting the network and start proving exactly where the issue is.

How TrueDEM pinpoints network issues for M365

Full connectivity journey tracingEvery hop from device to cloud, RTT per segment, 90 days of history.
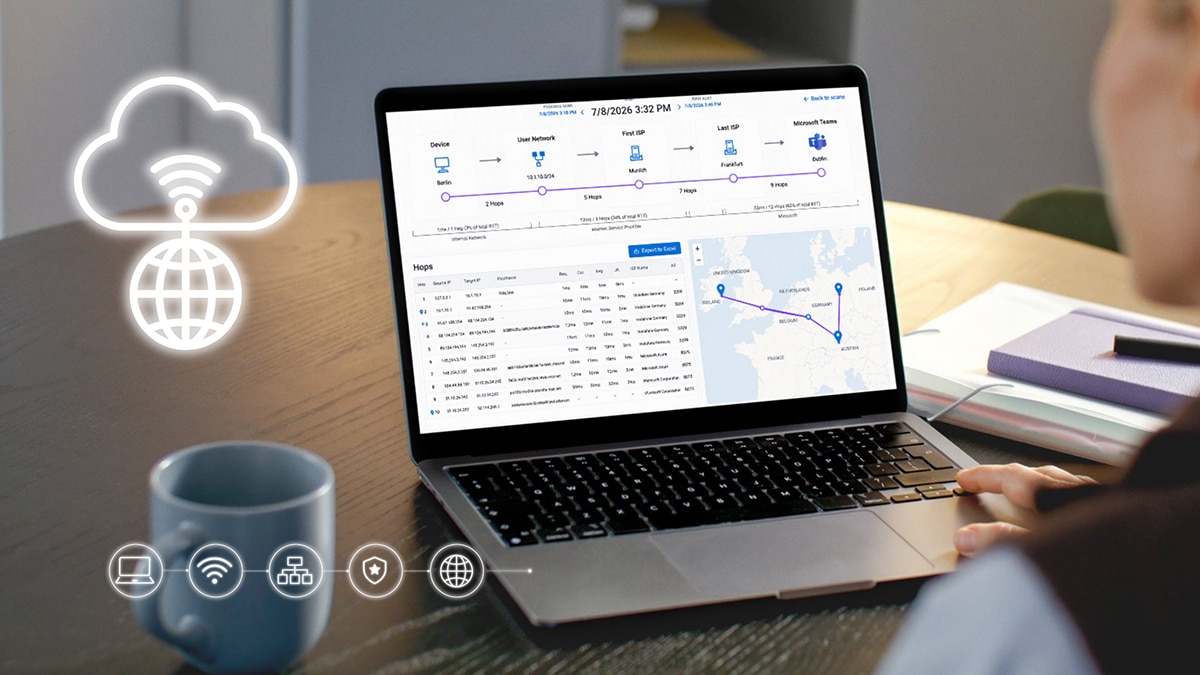
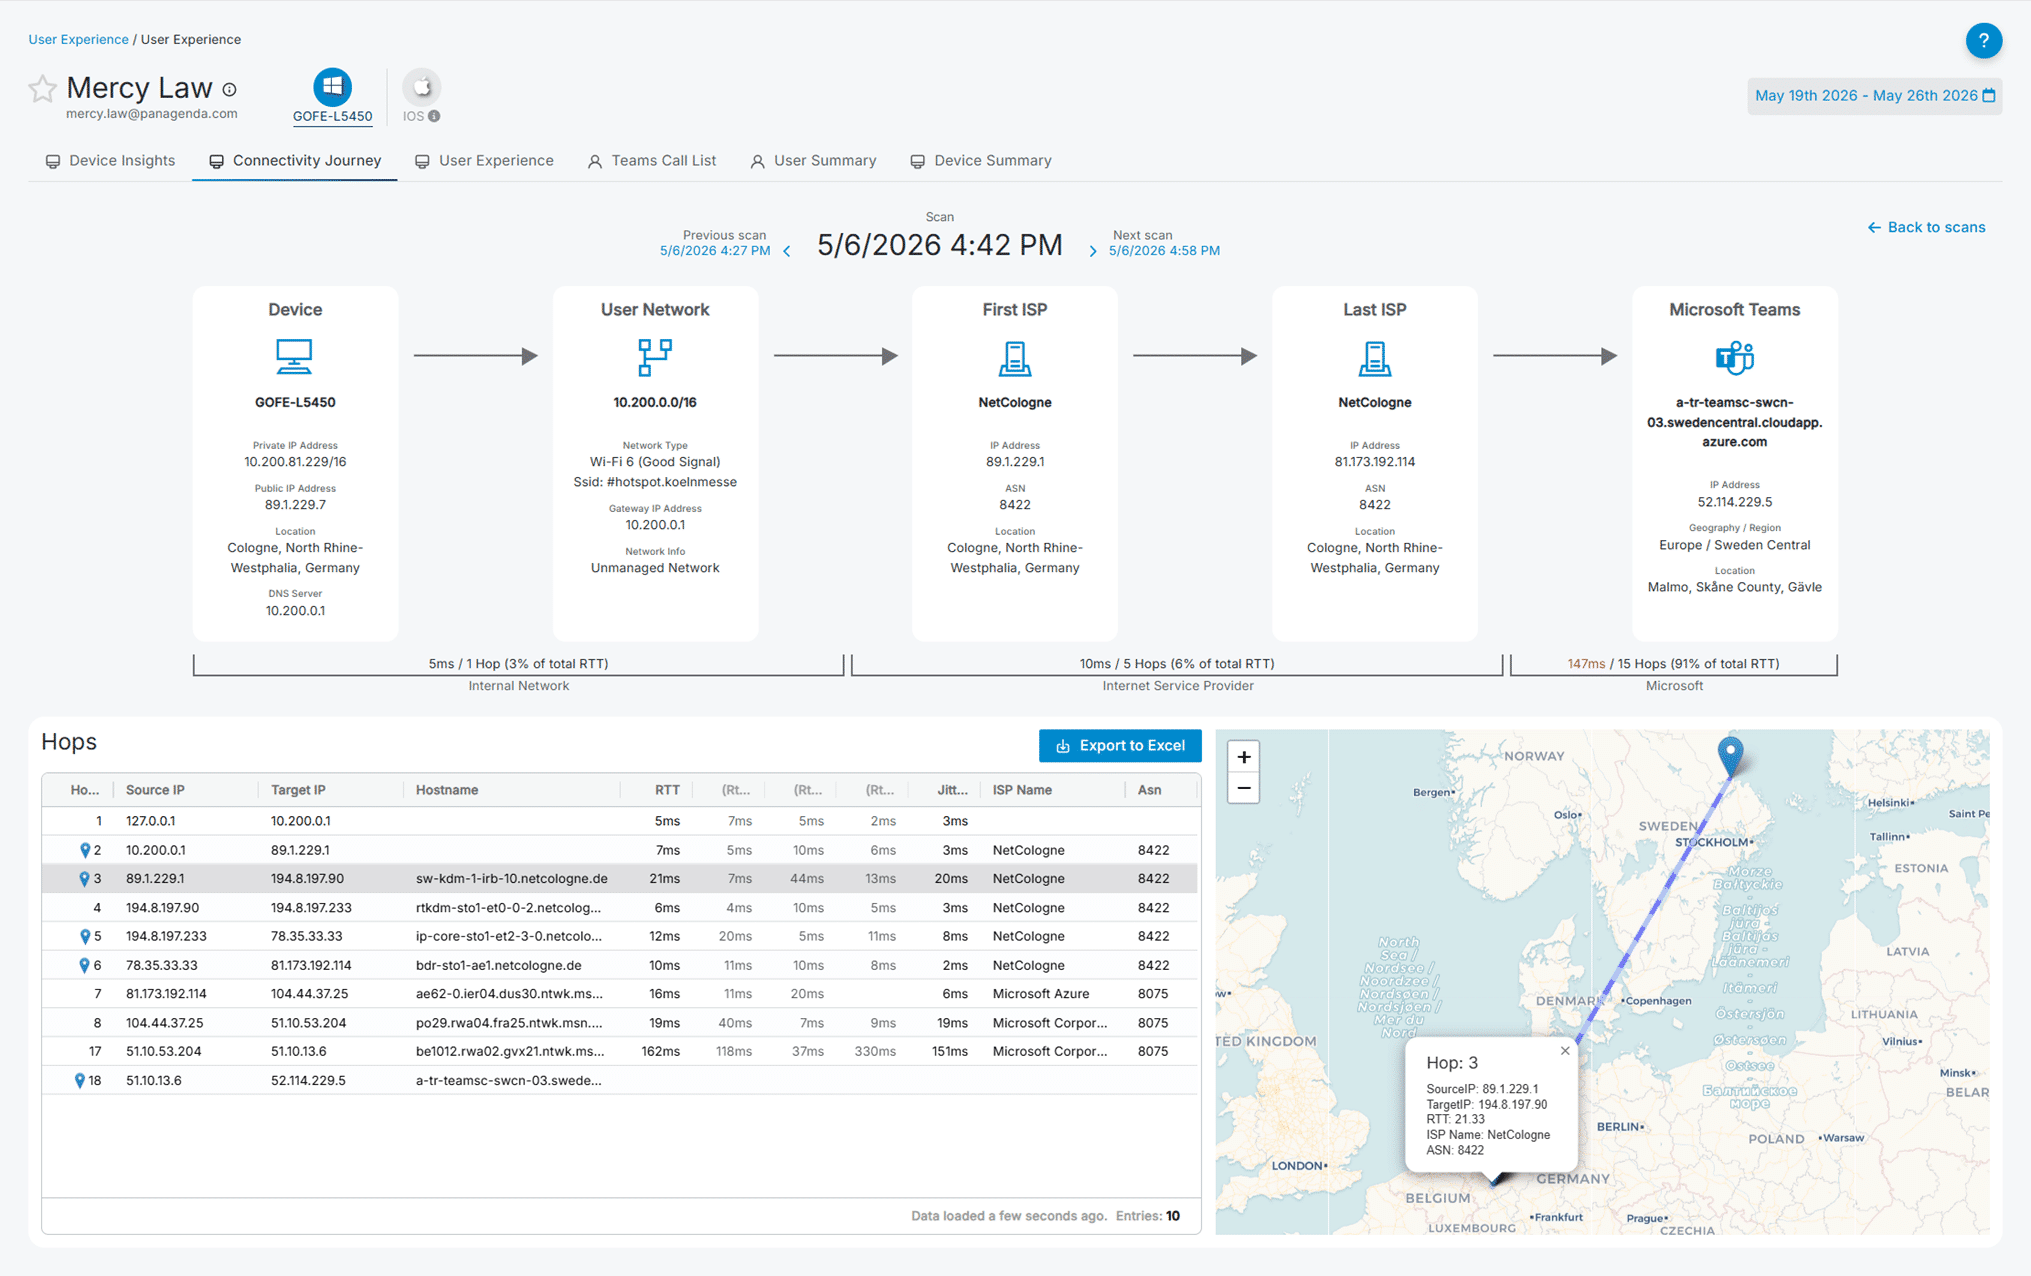
For any user, TrueDEM traces the exact route from their device to Microsoft’s cloud, showing every hop: local network, ISP entry and exit points, Microsoft’s edge and data center. You see the round-trip time at each segment so you know exactly where latency is introduced. Scans available for up to 90 days.
Wi-Fi quality scoring and analysisFlag substandard networks, managed or unmanaged.
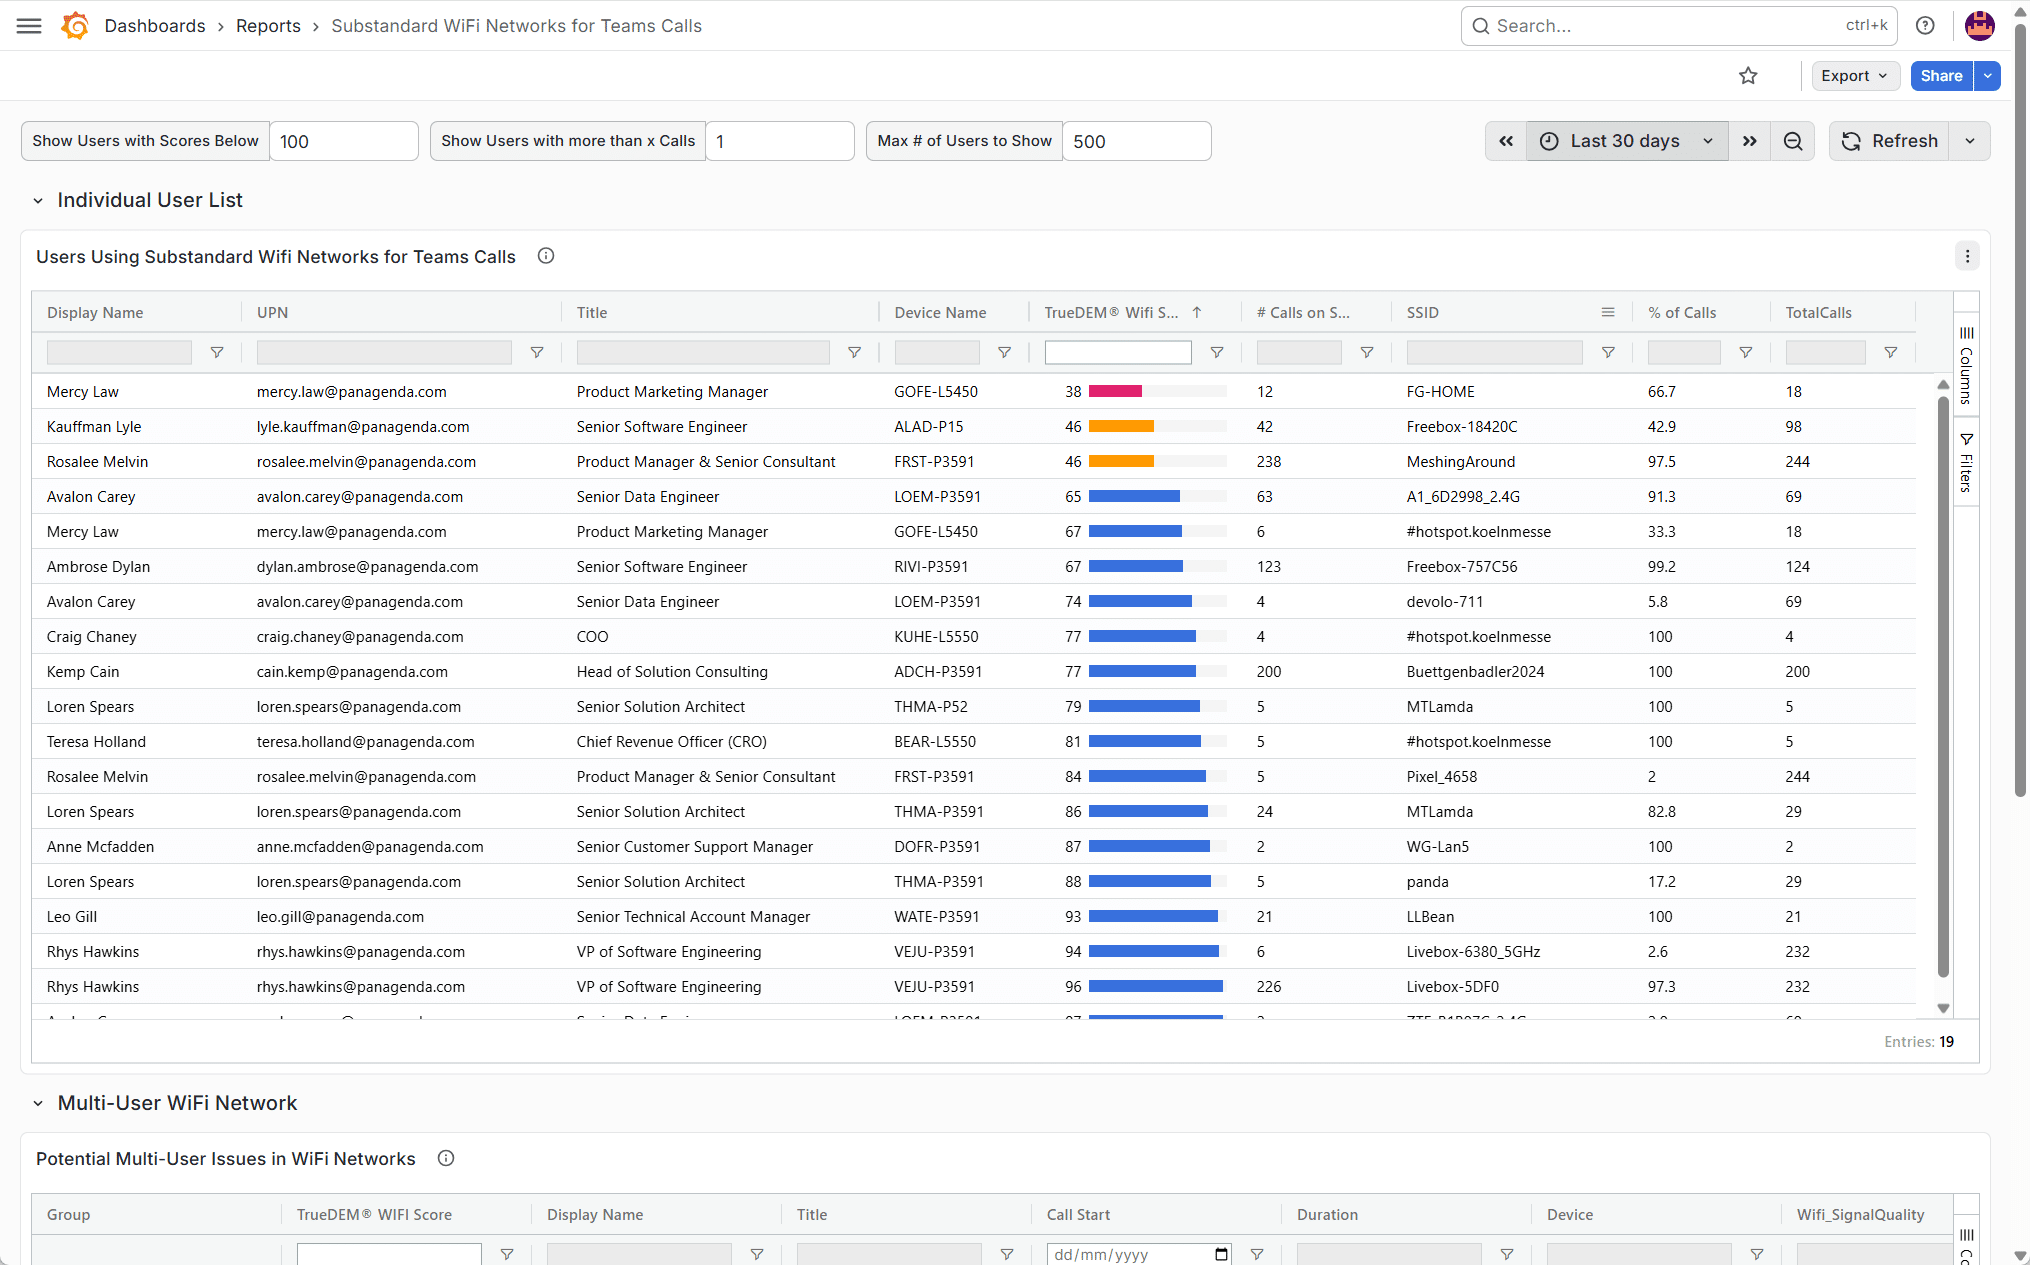
TrueDEM correlates Teams call quality with Wi-Fi network performance, flagging networks that fall below acceptable standards for real-time communication. See which users are making calls from substandard Wi-Fi and prioritize remediation for the networks causing the most impact.
Managed network call quality overviewWhich locations have the highest poor-call ratios.
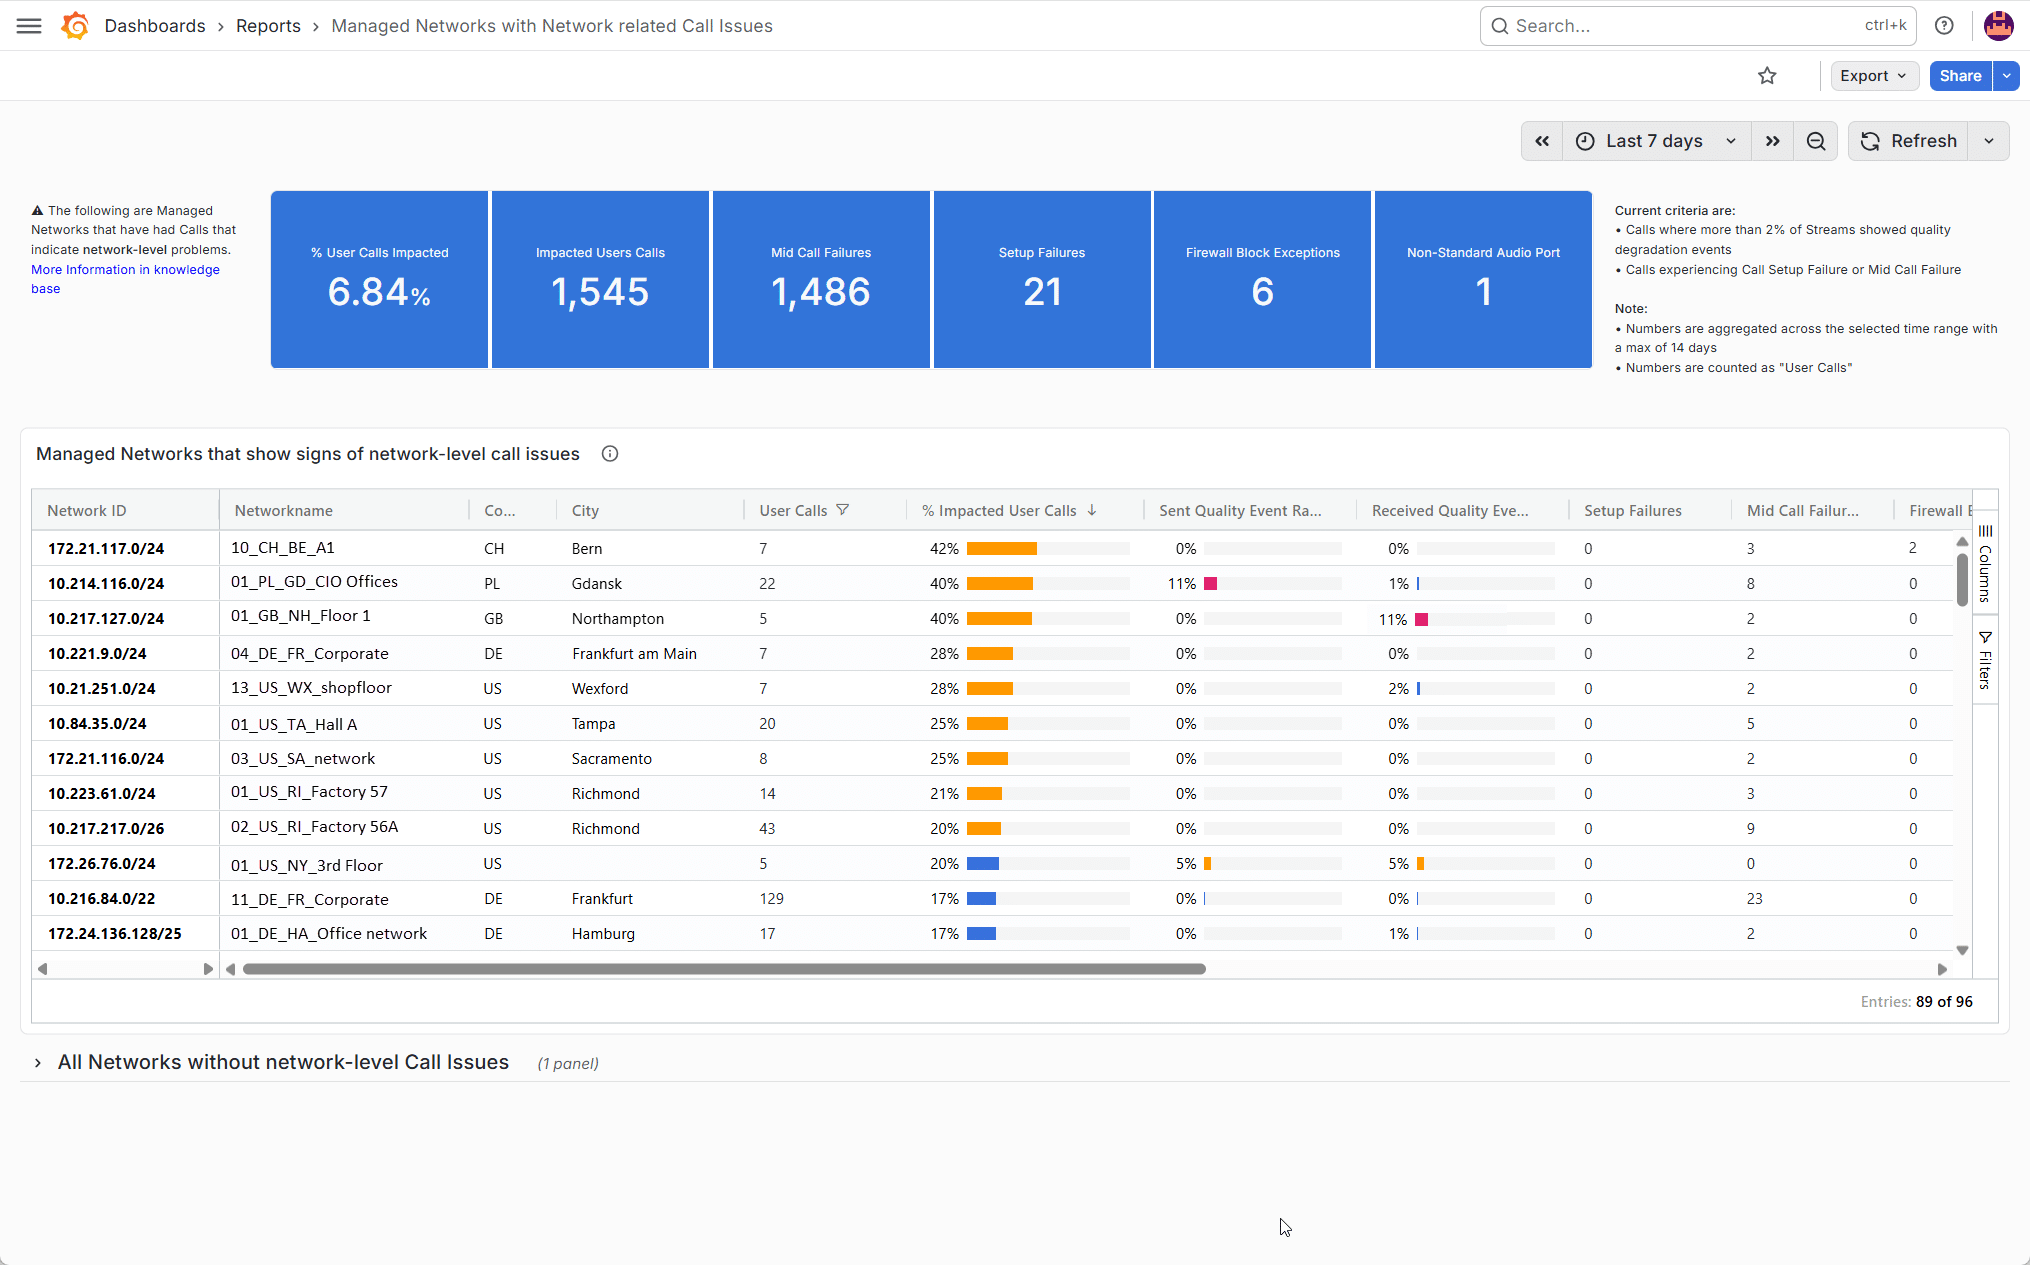
For corporate networks under IT’s control, TrueDEM identifies which locations have the highest ratios of poor-quality calls. The report breaks down send vs. receive stream quality, call setup failures, and mid-call failures, isolating network-level issues from device or cloud-side problems.
VPN detection and impact visibilitySee when users are on VPN, correlate with performance.
TrueDEM’s Device Insights timeline shows when users are connected via VPN (virtual adapter detection), allowing you to correlate VPN usage with performance changes. Combined with the connectivity journey, you can see whether a VPN is routing traffic through an inefficient path.
ISP performance comparisonPer-ISP scores against baselines, by location. Evidence for escalations.
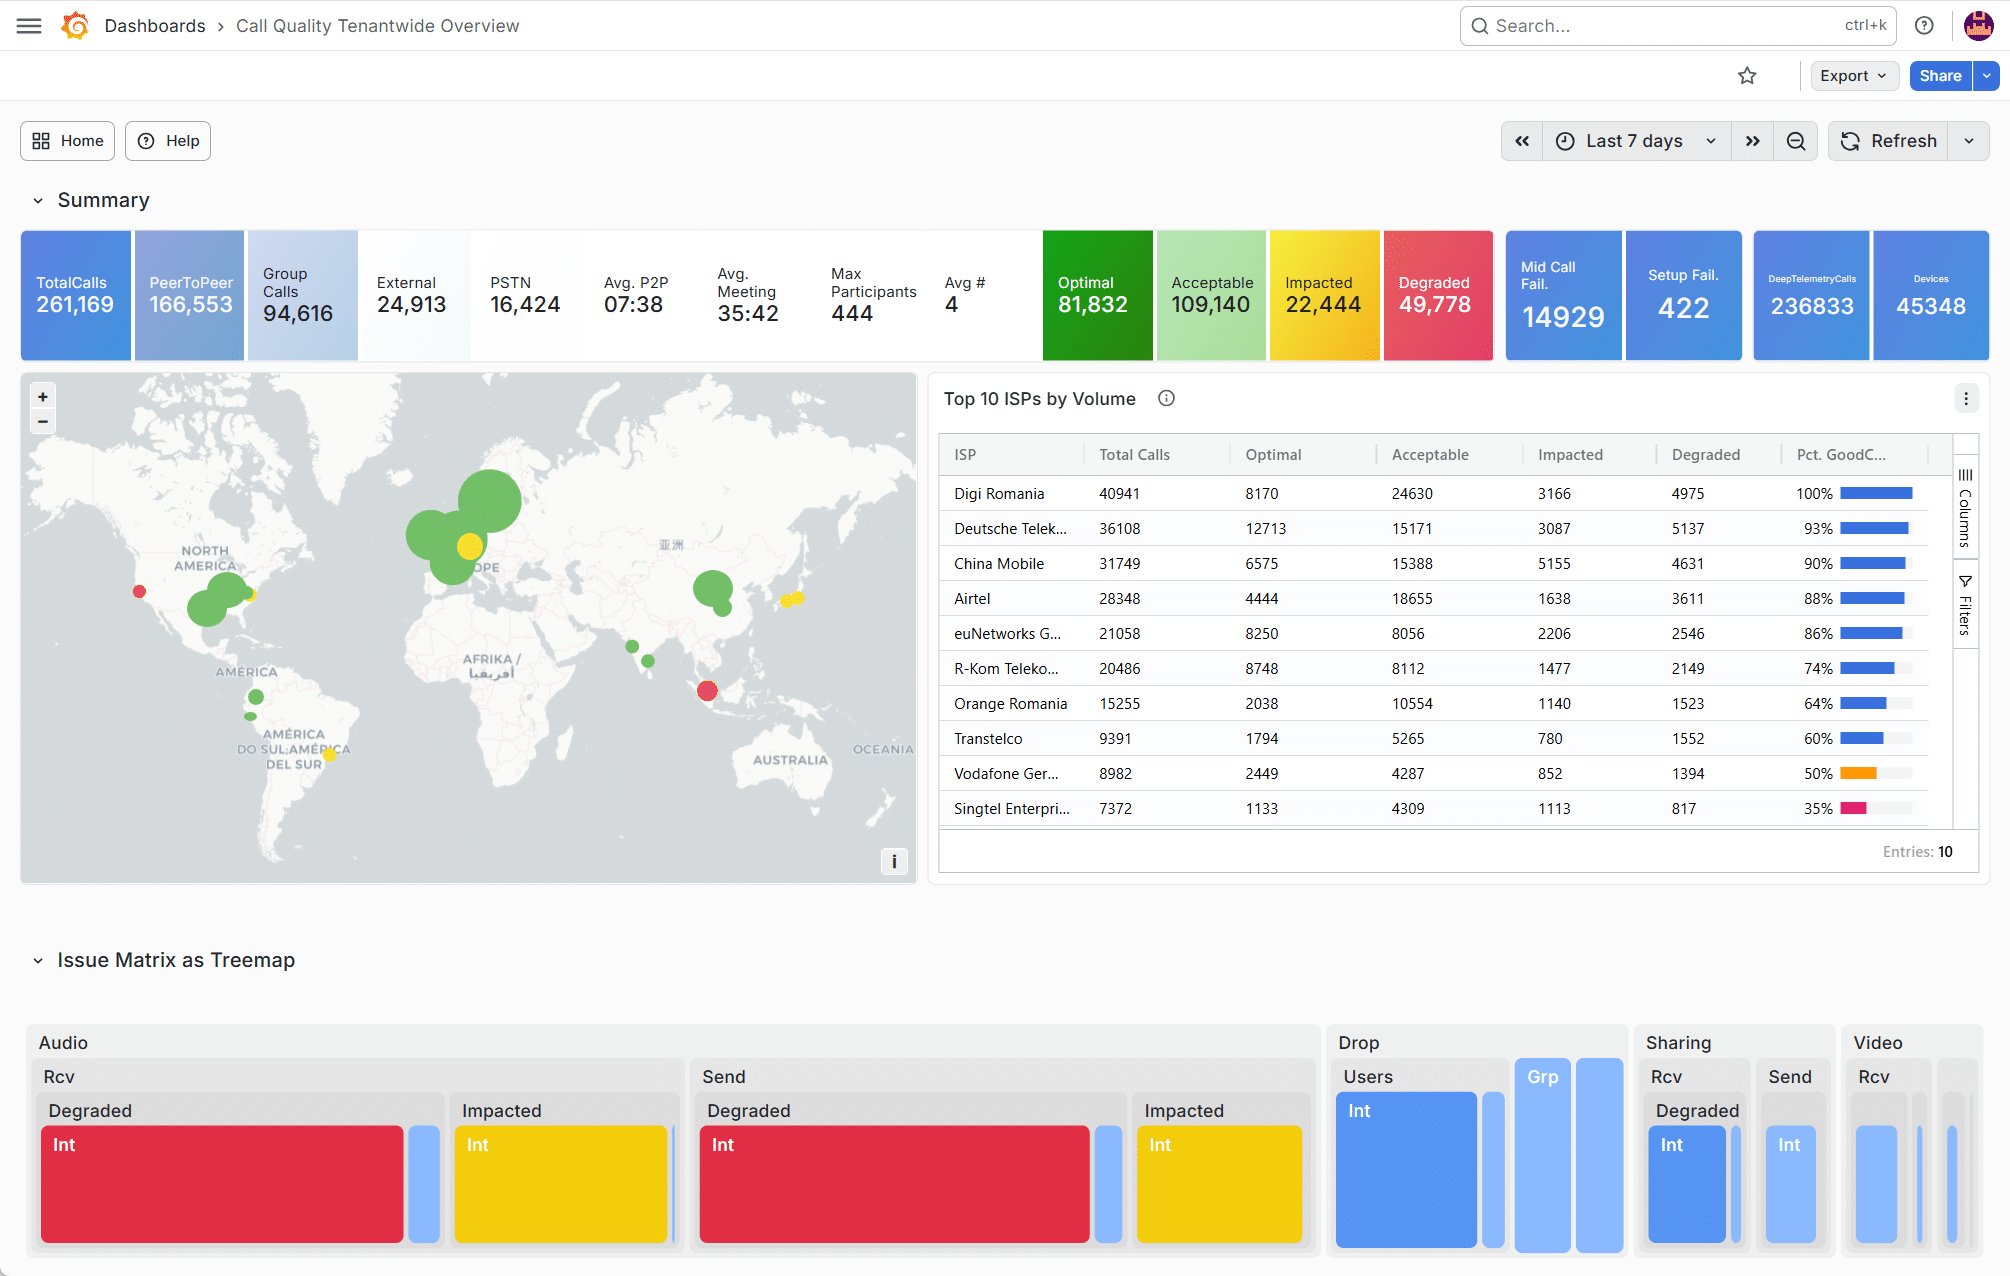
See which ISPs your users connect through, with performance scores against historical baselines. Identify ISPs that consistently cause latency or packet loss for M365 traffic, broken down by user location. Drill into any ISP to see individual hops and round-trip times.
Per-user network contextWi-Fi/wired connections, BSSID changes, VPN periods on one timeline.
Network is the top category on TrueDEM’s Device Insights view because it’s the most critical element of the user experience journey. See Wi-Fi and wired connections, BSSID changes (when a user roams between access points), VPN usage periods, and how each change correlates with performance.

What you actually see in TrueDEM

Connectivity Journey

Select a user, date, and time to see the full network path they took to reach Microsoft Teams or Exchange Online. Every hop from device through internal network, ISP(s), and into Microsoft’s infrastructure, with round-trip time measurements at each segment. Scans retained for up to 90 days.

Wi-Fi Networks Analysis

A report identifying users making Teams calls from Wi-Fi networks below acceptable standards for real-time communication. Filter by minimum score threshold and call count to focus on the most impacted users first. Click any user for per-call Wi-Fi quality scores.

Managed Networks Call Overview

Identifies corporate networks with the highest ratios of poor-quality Teams calls using network-specific metrics: call setup failures, mid-call failures, and send/receive quality event ratios. Analyze whether problems are outbound, inbound, or both.

ISP Overview

Per-ISP performance data showing response times, hop counts, and user distribution. Identify ISPs causing latency spikes and compare ISP performance across locations. Click any ISP for routing detail.

Teams Relay Region Analysis

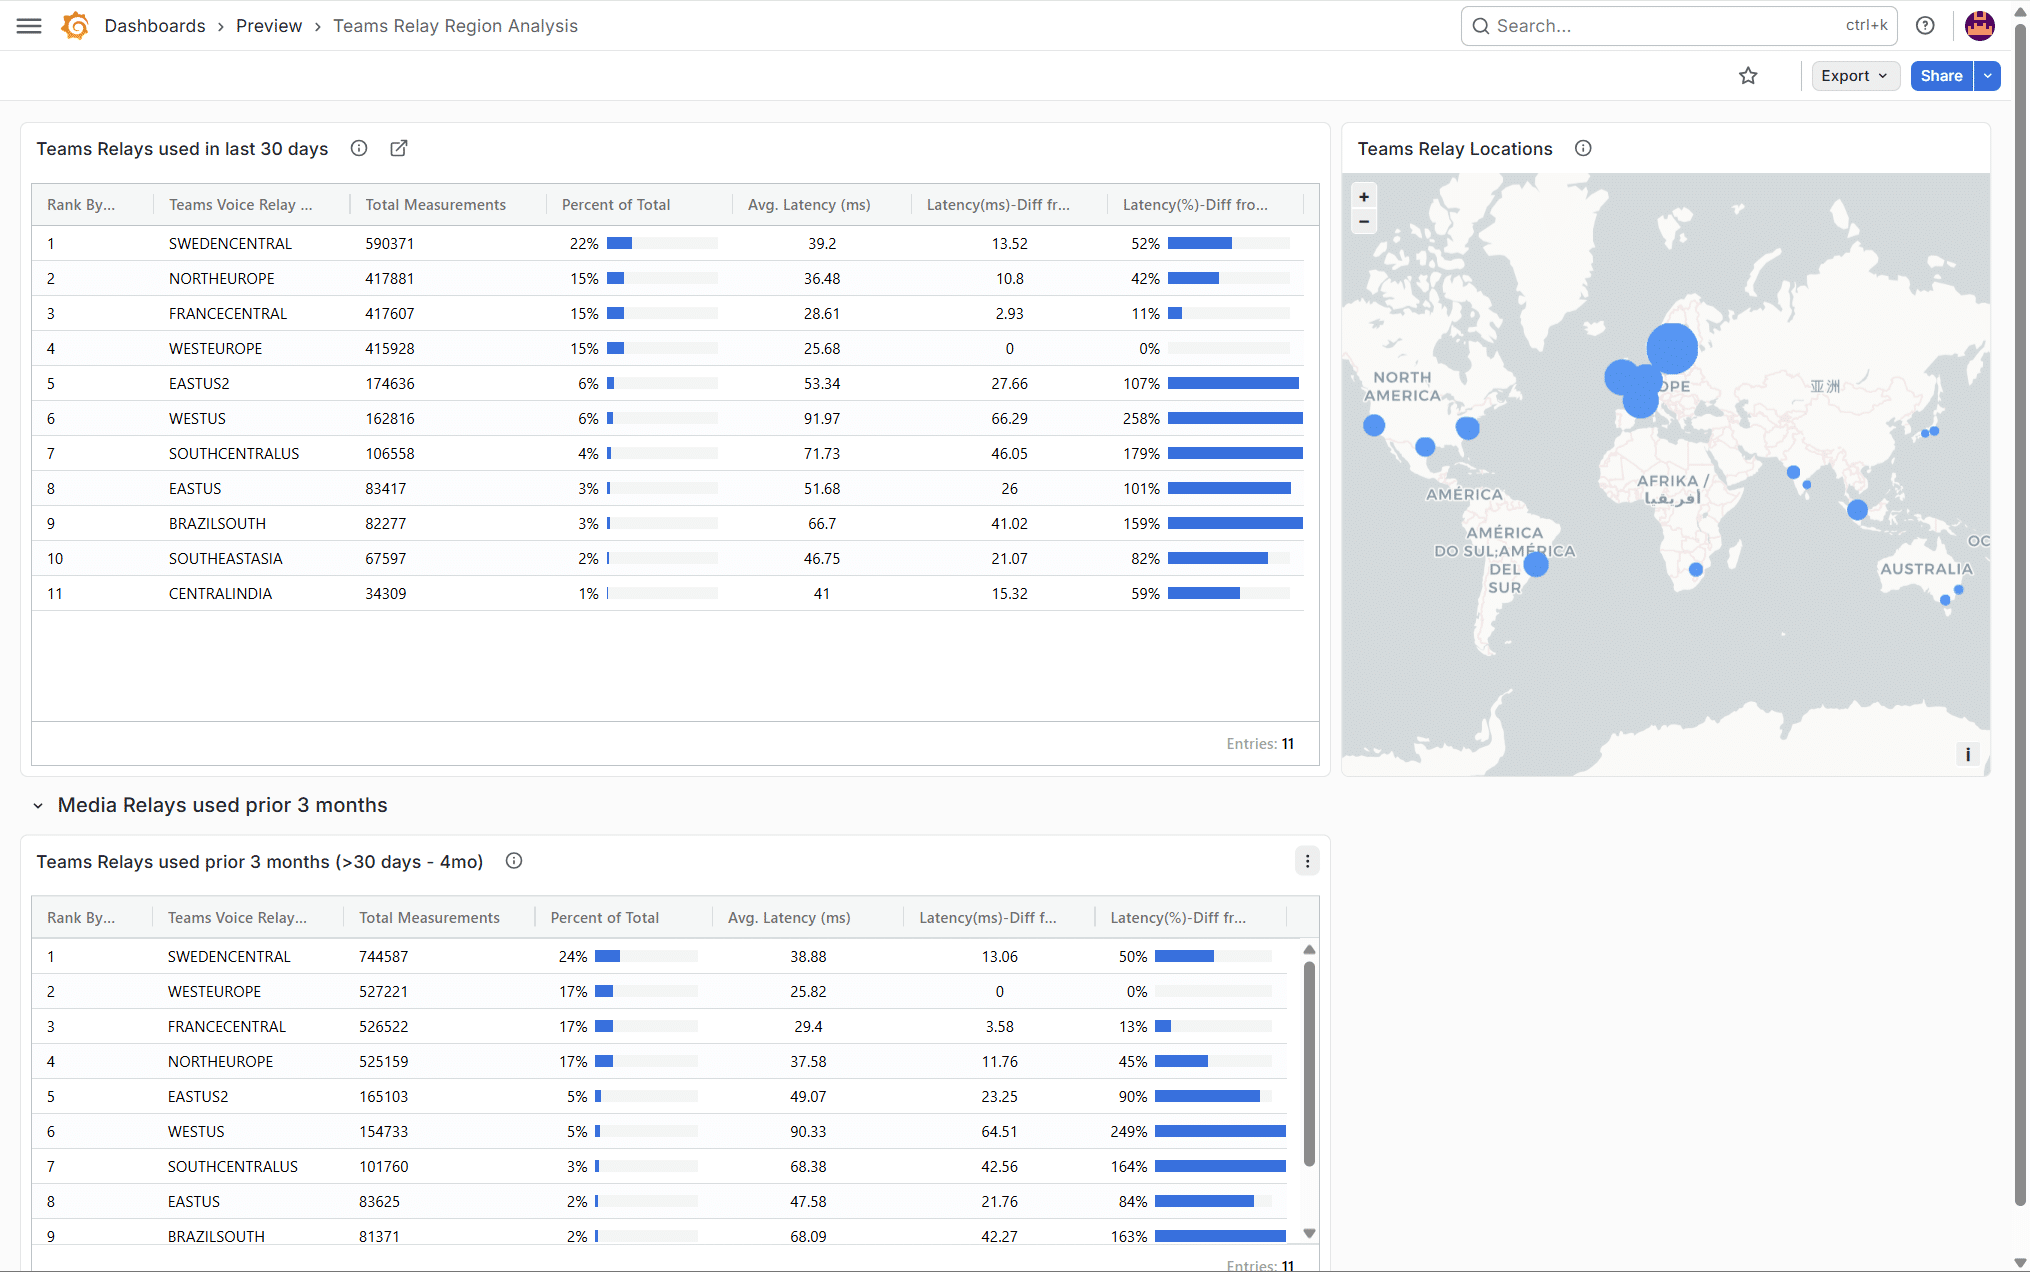
See which Microsoft media relay regions handle your call traffic and how they compare. Relays are ranked by latency against the fastest region as benchmark, with both absolute and percentage impact shown. A comparison view covers the prior three months to surface changes over time.

What you actually see in TrueDEM

Connectivity Journey

Select a user, date, and time to see the full network path they took to reach Microsoft Teams or Exchange Online. Every hop from device through internal network, ISP(s), and into Microsoft’s infrastructure, with round-trip time measurements at each segment. Scans retained for up to 90 days.

Wi-Fi Networks Analysis

A report identifying users making Teams calls from Wi-Fi networks below acceptable standards for real-time communication. Filter by minimum score threshold and call count to focus on the most impacted users first. Click any user for per-call Wi-Fi quality scores.

Managed Networks Call Overview

Identifies corporate networks with the highest ratios of poor-quality Teams calls using network-specific metrics: call setup failures, mid-call failures, and send/receive quality event ratios. Analyze whether problems are outbound, inbound, or both.

ISP Overview

Per-ISP performance data showing response times, hop counts, and user distribution. Identify ISPs causing latency spikes and compare ISP performance across locations. Click any ISP for routing detail.

Teams Relay Region Analysis

See which Microsoft media relay regions handle your call traffic and how they compare. Relays are ranked by latency against the fastest region as benchmark, with both absolute and percentage impact shown. A comparison view covers the prior three months to surface changes over time.

TrueDEM maps the complete network journey for every user, from their device through every hop to Microsoft’s cloud, so you can stop suspecting the network and start proving exactly where the issue is.

Real-world: Network problems you can finally prove

The ISP nobody could prove was the problem
Users in one region complain for weeks. Everyone assumes it’s Microsoft. TrueDEM shows one ISP with consistently elevated round-trip times while others in the same area score normally. Per-ISP, per-location evidence to escalate, not “our users say it’s slow” but data, hop by hop.

The network change that broke Teams without anyone noticing
Routine routing change on Thursday. No complaints. Friday morning, TrueDEM flags a spike in call setup failures at that location. Users haven’t escalated. The data is clear: something changed. Rolled back before the Monday ticket flood.

Customer stories

Alan Woods | Infrastructure Service Manager at Pharmac

Pharmac entered the Covid lockdowns with a robust Business Continuity Plan but once all staff began working from home, we realized that home Wi-Fi and internet connections presented a major blind spot. TrueDEM gives us granular visibility of those factors."

Alan Woods, Infrastructure Service Manager | Pharmac, New Zealand

Jicky Li | Senior Manager IT at IIC - INTERSPORT International Corporation GmbH

With TrueDEM, it enhanced our visibility so we could see the data from a user computer all the way to the Microsoft Service."

Jicky Li, Senior Manager IT | IIC - INTERSPORT International Corporation GmbH

Frequently asked questions

What network data does TrueDEM collect?

TrueDEM collects a broad range of network telemetry from the user’s endpoint including (among other things) Wi-Fi signal strength, channel, BSSID, and band; wired connection details; VPN adapter detection; bandwidth and latency measurements; packet loss and jitter; and full traceroute data showing every hop from the device to Microsoft’s cloud with round-trip times per segment.

Can TrueDEM detect VPN routing issues?

Yes. TrueDEM detects when a user is connected via VPN through virtual adapter identification and shows the impact on the connectivity journey. You can compare the network path and round-trip times with and without VPN active, making it straightforward to identify cases where full-tunnel VPN routing is adding unnecessary latency, and to verify that split tunneling is working correctly after configuration changes.

Does TrueDEM replace traditional network monitoring tools?

No, it complements them. Traditional LAN/WAN tools monitor your corporate network infrastructure. TrueDEM monitors the network from the user’s perspective, covering the segments that traditional tools can’t see: home Wi-Fi, ISP routing, VPN impact, and the last mile to Microsoft’s cloud. Together they provide complete network visibility.

How does TrueDEM identify which Wi-Fi networks are problematic?

TrueDEM correlates Teams call quality data with Wi-Fi network information, scoring each network against established thresholds for real-time communication (such as minimum signal strength requirements). Networks scoring below these thresholds are flagged, and you can see which users are making calls from substandard Wi-Fi, both on managed corporate networks and on unmanaged home or public networks.

Can TrueDEM help with ISP escalations?

Yes. TrueDEM provides per-ISP performance data with round-trip times, hop counts, and historical trends. When you need to escalate a performance issue to an ISP, you have specific evidence: which users are affected, what the latency looks like at each hop, and how that ISP’s performance compares to others in the same region. This turns a vague “our users say it’s slow” into a data-backed service request.

How far back does network data go?

Connectivity journey scans are retained for up to 90 days, allowing historical comparison. This is particularly useful for identifying whether a routing change or ISP behavior shift coincides with a change in user experience over time.

See what’s between your users and Microsoft’s cloud

Roll out the TrueDEM agent. Network path visibility starts flowing immediately.