Some of our customers who upgraded to Notes 11 have experienced out of memory errors in the Notes client.
Sometimes it was a message box that said there is not enough free memory, sometimes it was a hang with errors in the trace log. It generally happened after the client had been open for a while, and often when opening MIME emails that were sent from the Internet or clicking on links to open an external browser. If users were logged in to Sametime, it was more likely to happen.
The weird thing about this:
- The computer had plenty of available memory, and
- Task Manager showed that Notes was using a normal amount of memory, maybe 250MB or so.
What the heck was going on, and what can we do to fix it?
Different Kinds of Memory
The first clue is that Task Manager only shows the working set memory for an application: essentially the amount of memory in use. That’s a good number to know, and in most cases that’s the number that’s important, but there are other ways you can run out of memory. We opened Windows Performance Monitor to take a closer look.
Performance Monitor has a Processes section with additional memory measurements that you can track. Specifically, we looked at “Private Bytes” (the amount of committed memory the application is using) and “Virtual Bytes” (the amount of virtual address space the application has reserved). Here’s a screenshot of Performance Monitor and Task Manager side-by-side while the Notes client is running:
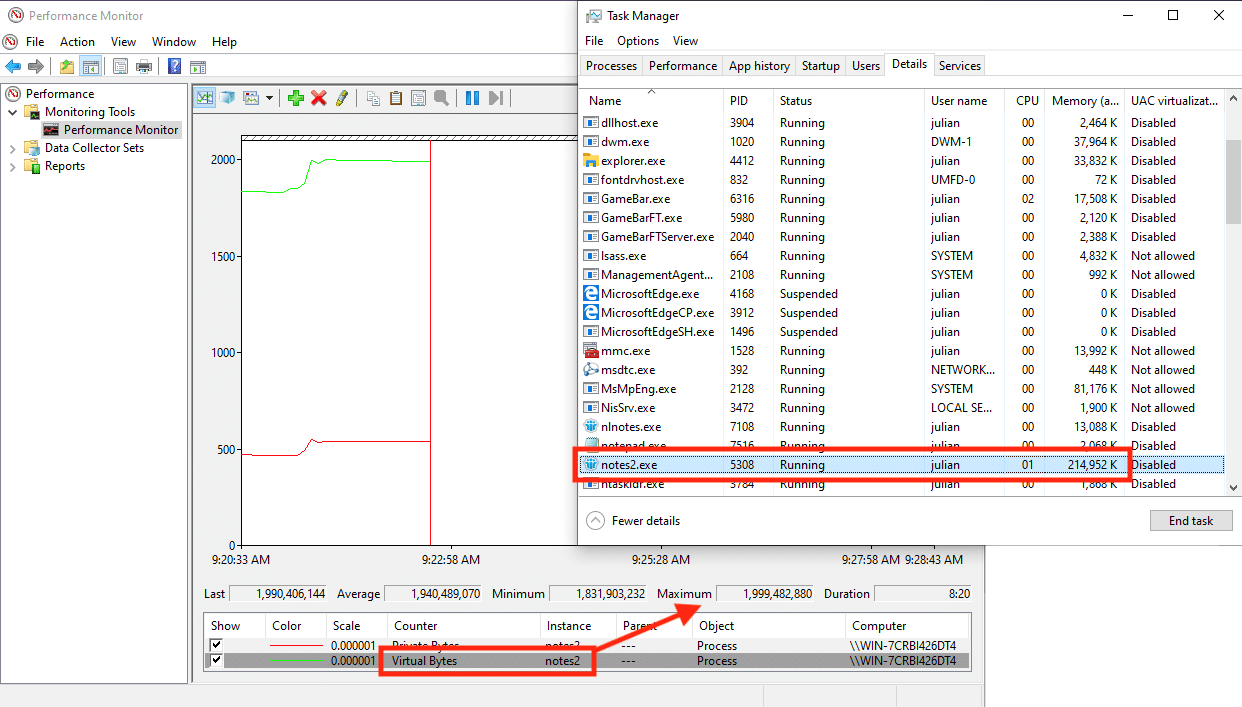
You can see that while Task Manager shows 215MB of memory in use, Performance Monitor tells us there is almost 2GB of virtual address space being reserved. When we were testing, we found that out of memory errors were happening at the point that the client hit the 2GB mark in the virtual address space monitor.
This 2GB mark is important because the Notes client is still a 32-bit application. One of the side-effects of this is it only has 2GB of virtual address space to play with (really 4GB, but half of that is claimed by the kernel). 64-bit applications have a much, much larger virtual address space (they sometimes reserve terabytes of space), but 32-bit applications need to be careful.
SIDEBAR: A few clarifications about virtual address space:
- it’s completely different from virtual memory
- it doesn’t tell you how much memory the application is actually using
- it has nothing to do with how much memory is on the computer
- it’s a way of mapping memory that might be used by the application
Beyond that it’s a little hard to explain, and most people don’t care, but if you’re interested this is a nice summary: https://docs.microsoft.com/en-us/windows-hardware/drivers/gettingstarted/virtual-address-spaces
Anyway, knowing what we know, why is it using that much, and how can we fix the problem?
Reducing the Java Heap Size
Spoiler alert: The immediate fix was to reduce the Java heap size used by the Notes client. This seems counter-intuitive – normally when you have an out of memory error, you want to increase the memory – but keep reading.
The Java heap size for the client is controlled by a parameter in the jvm.properties file, in the Notes/framework/rcp/deploy directory. It has an entry like this:
vmarg.Xmx=-Xmx512m
This controls the maximum size of the Java heap, which is the amount of memory Java (and in this case the Notes client) uses for running code. The default value for Notes is 512MB, as shown in the parameter above. However, a lot of customers like to increase this if they are doing memory-intensive things with their Notes clients, especially if they are using Domino Designer.
This is a fairly common parameter to adjust, and there’s even a technote about changing it here.
Our customers who were getting out of memory errors had this parameter set to 1024MB. This was never a problem with Notes 9, but suddenly with Notes 11 it was too much memory to assign to the heap.
By reducing this back down to Xmx512m, the out of memory errors went away.
We could also confirm on Performance Monitor that using a 512MB heap reduced the virtual address space to about 1.5GB, which gave the client a lot more breathing room when it needed to reserve some extra chunks of space.

Why Wasn’t This a Problem Before?
The next obvious question is: why didn’t the customers have this problem with the Notes 9 client?
When you compile a 32-bit application, there is a flag you can set called /LARGEADDRESSAWARE. This allows the application’s process to use a full 4GB of virtual address space on a 64-bit operating system, instead of the 2GB we were seeing above.
It turns out that the java.exe and notes2.exe files on the Notes 9 client were compiled with the /LARGEADDRESSAWARE flags, but the java.exe and notes2.exe files on the Notes 11 client were not.
Notes 9 used the IBM version of the Java JVM but Notes 11 uses the OpenJDK OpenJ9 version. The OpenJ9 32-bit distribution wasn’t compiled with /LARGEADDRESSAWARE until just recently (version 8u262, from June 2020), so the Notes 11 client didn’t compile with that flag either.
In other words, Notes 9 had a full 4GB virtual address space, but Notes 11 only has 2GB.
A Fix Is Coming Soon
We have been in discussion with HCL about this, and they are aware of the problem and are planning a fix. Ram Krishnamurthy, Chief Architect of the HCL Notes Client, gave us this guidance:
“This is a known OpenJDK defect for 1.8 version on Windows only. A fix for this issue has been found by the OpenJDK team and will be doing a release of the fix shortly. This fix is currently being planned to be included in an upcoming 1101 Fix Pack. This only impacts v11 based versions since it bundles the OpenJDK. Until then the workaround documented in this article can be used.”
Once the Notes client uses a newer version of OpenJ9 and HCL is able to re-add the compiler flag, this problem will go away.